the graph below shows the value of the us dollar versus the canadian dollar. for the time period shown, the…
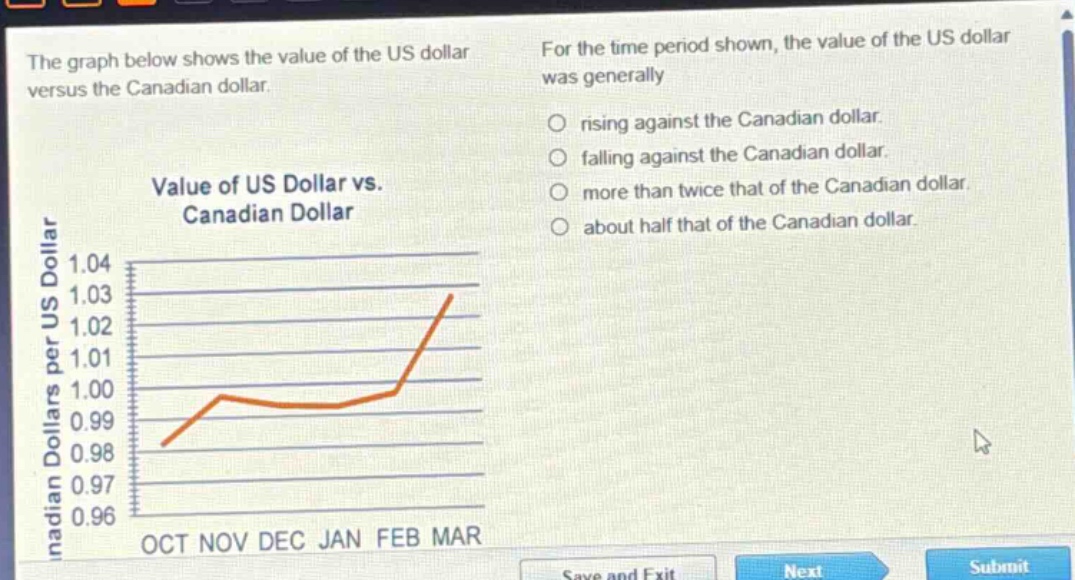
the graph below shows the value of the us dollar versus the canadian dollar. for the time period shown, the value of the us dollar was generally rising against the canadian dollar. falling against the canadian dollar. more than twice that of the canadian dollar. about half that of the canadian dollar. value of us dollar vs. canadian dollar oct nov dec jan feb mar
Answer
Brief Explanations:
By observing the graph, the value of the US - dollar per Canadian dollar is increasing over the time period from October to March. This indicates that the US dollar is rising against the Canadian dollar. The values are mostly around 1, so it is neither more than twice nor about half the value of the Canadian dollar.
Answer:
rising against the Canadian dollar.