the graphs show the us unemployment rate and the price of whole milk between 2006 and 2012. what do these…
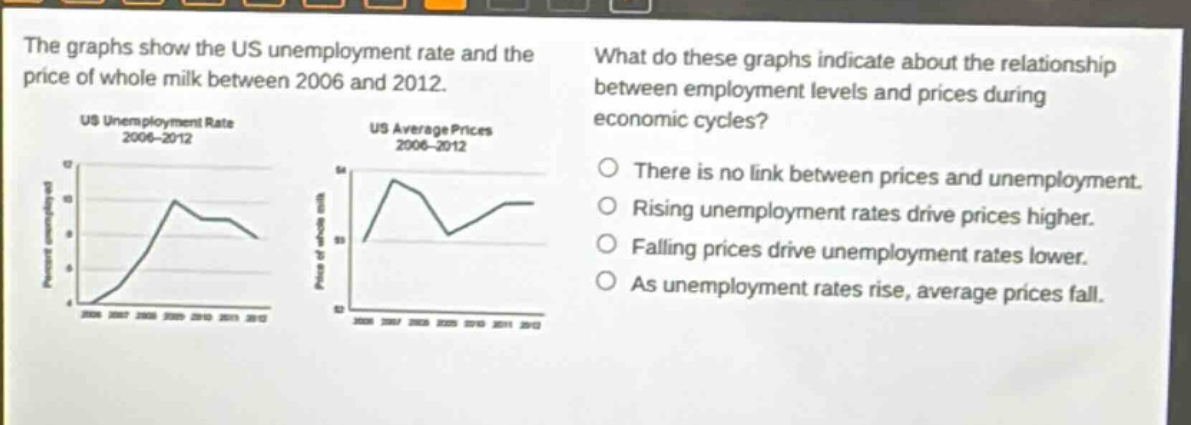
the graphs show the us unemployment rate and the price of whole milk between 2006 and 2012. what do these graphs indicate about the relationship between employment levels and prices during economic cycles? us unemployment rate 2006 - 2012 us average prices 2006 - 2012 there is no link between prices and unemployment. rising unemployment rates drive prices higher. falling prices drive unemployment rates lower. as unemployment rates rise, average prices fall.
Answer
Answer:
D. As unemployment rates rise, average prices fall.
Brief Explanations:
By observing the two graphs, when the unemployment - rate graph shows an upward trend, the average - price graph shows a downward trend, indicating an inverse relationship.