look at this chart. based on this chart about the snap benefits, what does the large jump between 2008 and…
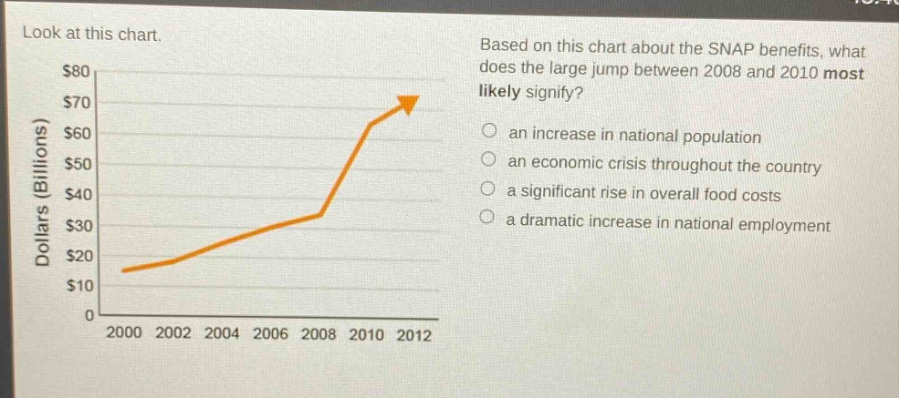
look at this chart. based on this chart about the snap benefits, what does the large jump between 2008 and 2010 most likely signify? an increase in national population an economic crisis throughout the country a significant rise in overall food costs a dramatic increase in national employment
Answer
Brief Explanations:
SNAP (Supplemental Nutrition Assistance Program) benefits are often affected by economic conditions. During an economic crisis, more people may need assistance, leading to an increase in SNAP spending. An increase in population or food - costs alone would not likely cause such a large, sudden jump. An increase in employment would likely decrease the need for SNAP benefits.
Answer:
an economic crisis throughout the country