look at this chart showing the economic impact of the great depression between 1929 and 1932. based on the…
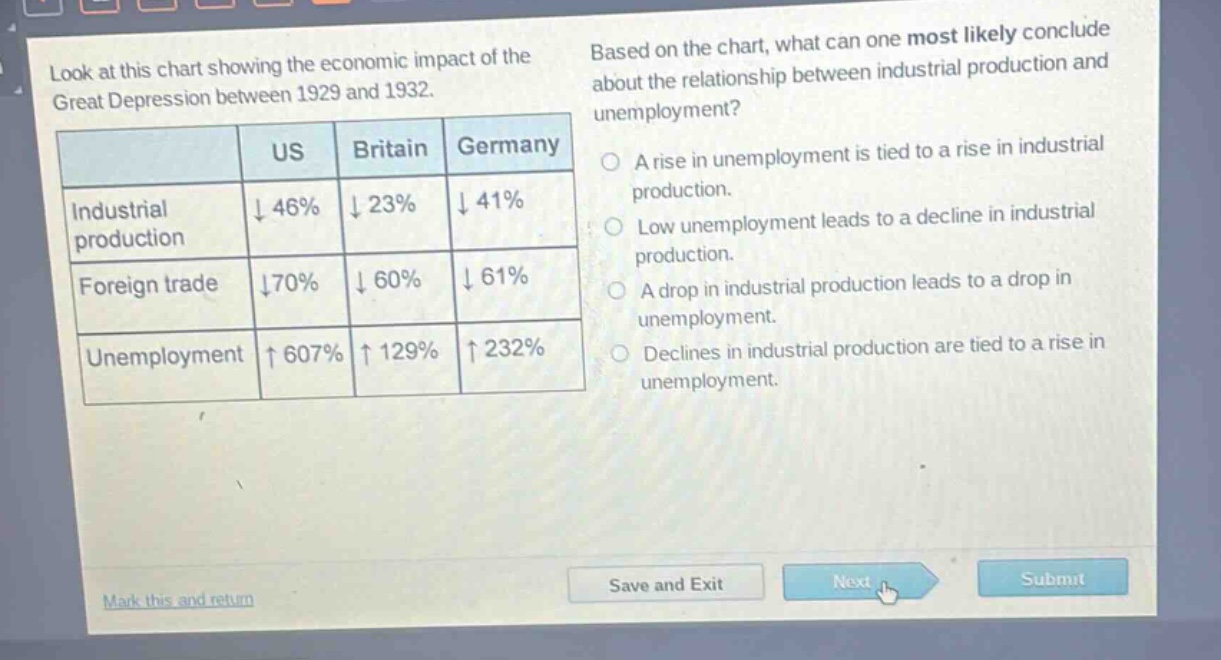
look at this chart showing the economic impact of the great depression between 1929 and 1932. based on the chart, what can one most likely conclude about the relationship between industrial production and unemployment? a rise in unemployment is tied to a rise in industrial production. low unemployment leads to a decline in industrial production. a drop in industrial production leads to a drop in unemployment. declines in industrial production are tied to a rise in unemployment.\n| | us | britain | germany |\n|--|--|--|--|\n| industrial production | ↓ 46% | ↓ 23% | ↓ 41% |\n| foreign trade | ↓ 70% | ↓ 60% | ↓ 61% |\n| unemployment | ↑ 607% | ↑ 129% | ↑ 232% |
Answer
Brief Explanations:
By observing the chart, as industrial production in the US, Britain, and Germany declined during 1929 - 1932, unemployment rates in these countries rose significantly. This shows an inverse - like relationship where lower industrial production is associated with higher unemployment.
Answer:
D. Declines in industrial production are tied to a rise in unemployment.