the map shows gdp per capita in the united states for a given year. what conclusion can someone draw from…
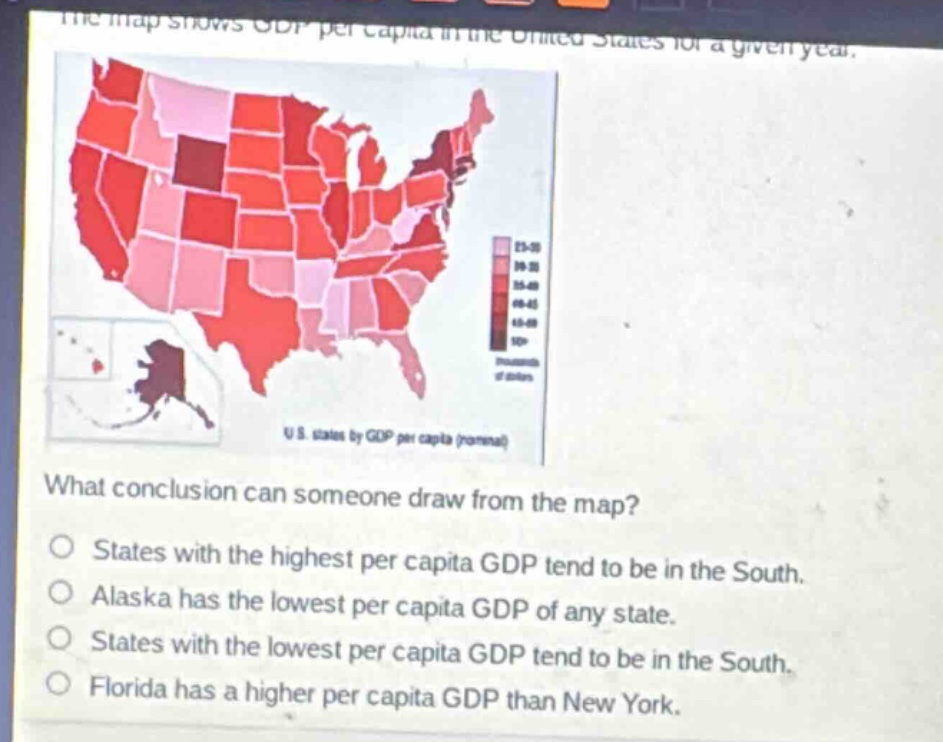
the map shows gdp per capita in the united states for a given year. what conclusion can someone draw from the map? states with the highest per capita gdp tend to be in the south. alaska has the lowest per capita gdp of any state. states with the lowest per capita gdp tend to be in the south. florida has a higher per capita gdp than new york.
Answer
Brief Explanations:
By observing the color - coded map of U.S. states' GDP per capita, we can see that the darker colors (indicating higher GDP per capita) are not concentrated in the South, and Alaska does not have the lowest GDP per capita. Also, Florida does not have a higher GDP per capita than New York. The states with lighter colors (lower GDP per capita) seem to be more prevalent in the South.
Answer:
States with the lowest per capita GDP tend to be in the South.