max is a software consultant who earns $1,000 a day for working an 8 - hour shift. which graph represents…
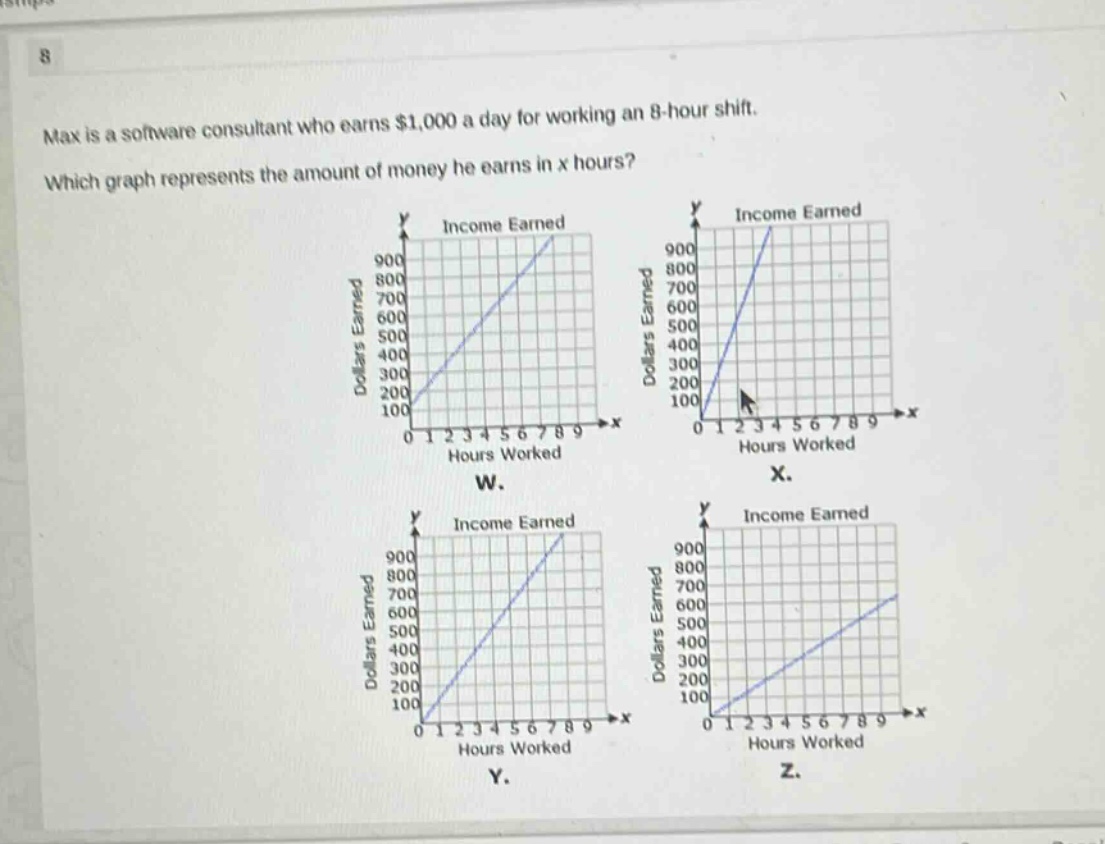
max is a software consultant who earns $1,000 a day for working an 8 - hour shift. which graph represents the amount of money he earns in x hours?
Answer
Explanation:
Step1: Calculate hourly - rate
Max earns $1000$ for an 8 - hour shift. The hourly rate $r$ is calculated by $r=\frac{1000}{8}=125$ dollars per hour.
Step2: Find the linear equation
The relationship between the amount of money $y$ earned and the number of hours $x$ worked is a linear equation of the form $y = mx + b$, where $m$ is the slope and $b$ is the y - intercept. Since he starts earning money when he starts working ($b = 0$) and $m=r = 125$, the equation is $y=125x$.
Step3: Check the graphs
When $x = 8$, $y=125\times8 = 1000$. For graph W: When $x = 8$, $y$ is approximately $900$ (not correct). For graph X: The slope is too steep. When $x = 1$, $y$ is much more than $125$ (not correct). For graph Y: When $x = 8$, $y = 1000$ and the slope is $125$ (correct). For graph Z: When $x = 8$, $y$ is approximately $700$ (not correct).
Answer:
Y.