number of employed workers in nonfarm jobs (2008 - 2013)\nthe graph shows employment figures for nonfarm…
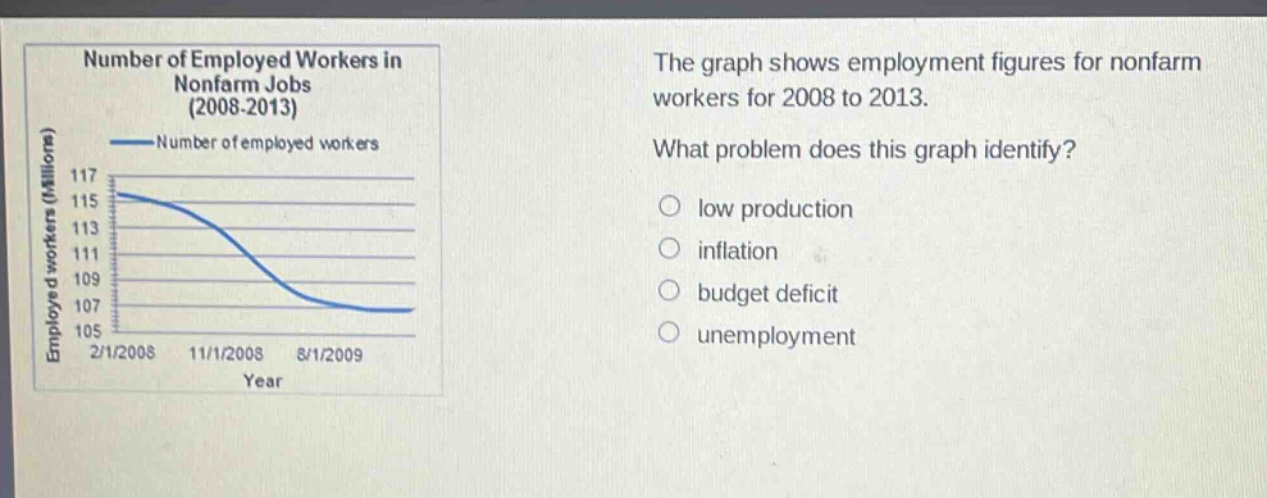
number of employed workers in nonfarm jobs (2008 - 2013)\nthe graph shows employment figures for nonfarm workers for 2008 to 2013.\nwhat problem does this graph identify?\nlow production\ninflation\nbudget deficit\nunemployment
Answer
Brief Explanations:
The graph shows a decline in the number of employed non - farm workers from 2008 to 2009. A decrease in employed workers is indicative of unemployment issues.
Answer:
unemployment