occupations with the highest employment levels, may 2013 according to the graph, approximately how many…
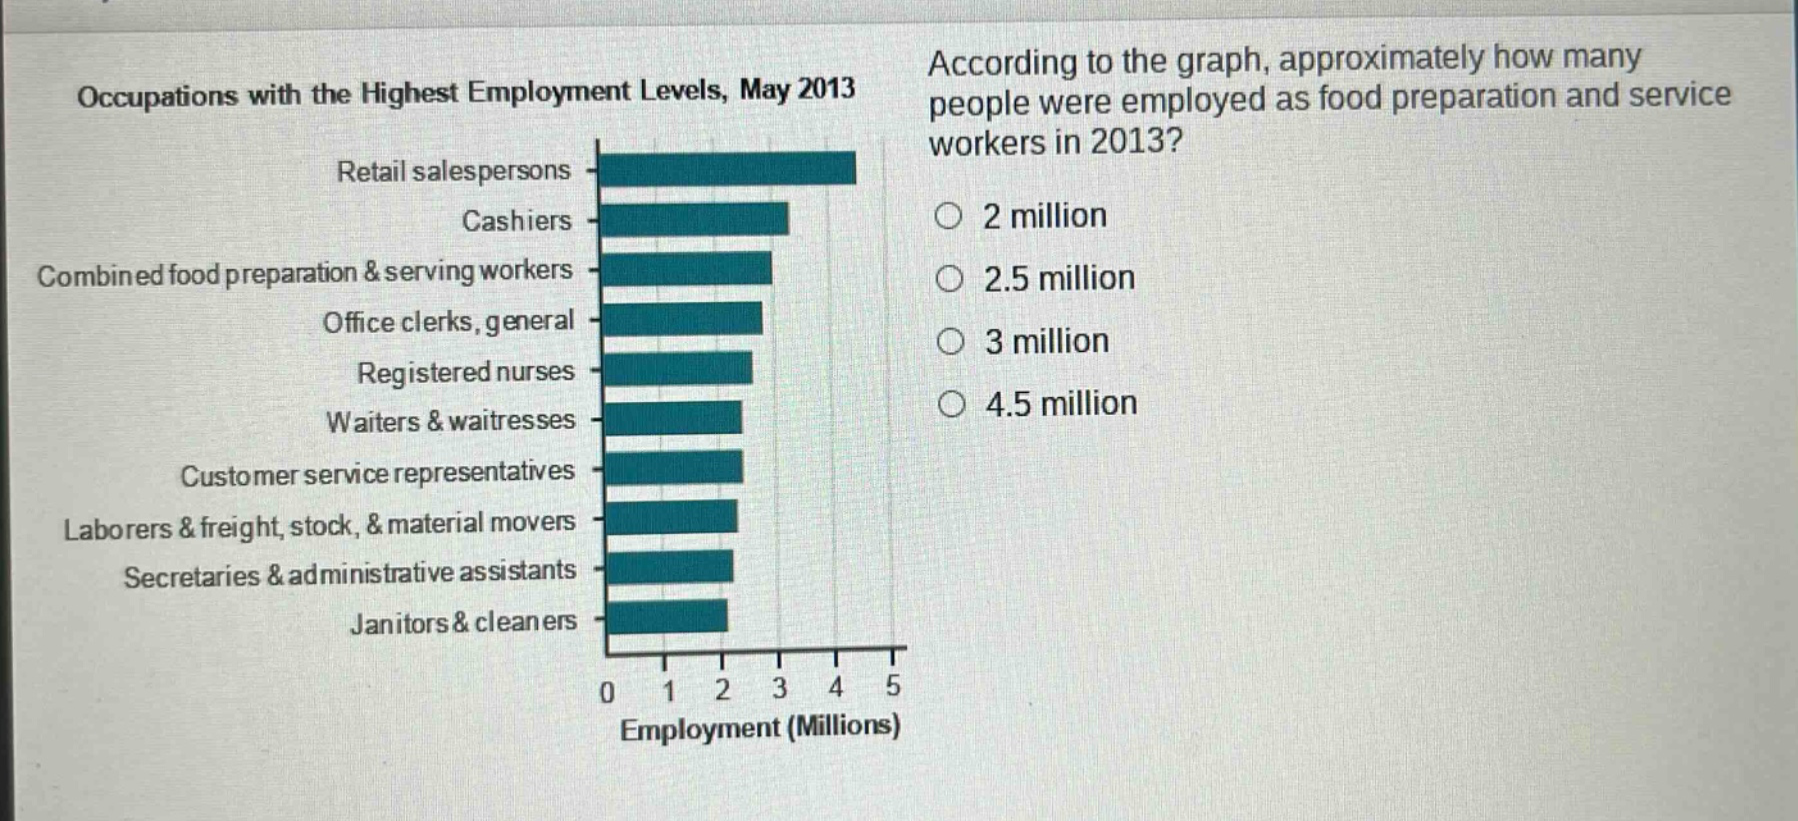
occupations with the highest employment levels, may 2013 according to the graph, approximately how many people were employed as food preparation and service workers in 2013? retail salespersons cashiers combined food preparation & serving workers office clerks, general registered nurses waiters & waitresses customer service representatives laborers & freight, stock, & material movers secretaries & administrative assistants janitors & cleaners 0 1 2 3 4 5 employment (millions) 2 million 2.5 million 3 million 4.5 million
Answer
Explanation:
Step1: Observe the bar - chart
Locate the bar for "Combined food preparation & serving workers".
Step2: Read the value
The end - point of the bar for "Combined food preparation & serving workers" is approximately at 3 on the horizontal axis labeled "Employment (Millions)".
Answer:
3 million