occupations with the highest employment levels, may 2013\nretail salespersons\ncashiers\ncombined food…
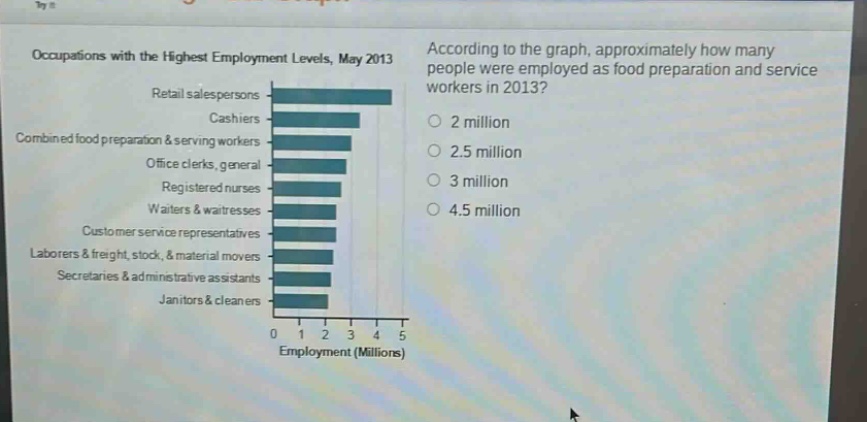
occupations with the highest employment levels, may 2013\nretail salespersons\ncashiers\ncombined food preparation & serving workers\noffice clerks, general\nregistered nurses\nwaiters & waitresses\ncustomer service representatives\nlaborers & freight, stock, & material movers\nsecretaries & administrative assistants\njanitors & cleaners\n0 1 2 3 4 5\nemployment (millions)\naccording to the graph, approximately how many people were employed as food preparation and service workers in 2013?\n2 million\n2.5 million\n3 million\n4.5 million
Answer
Explanation:
Step1: Observe the bar - graph
Locate the bar for "Combined food preparation & serving workers".
Step2: Estimate the value
The end of the bar for "Combined food preparation & serving workers" is close to 4.5 on the horizontal axis labeled "Employment (Millions)".
Answer:
4.5 million