the owner of a small café hopes to predict morning sales based on the temperature at opening time. for one…
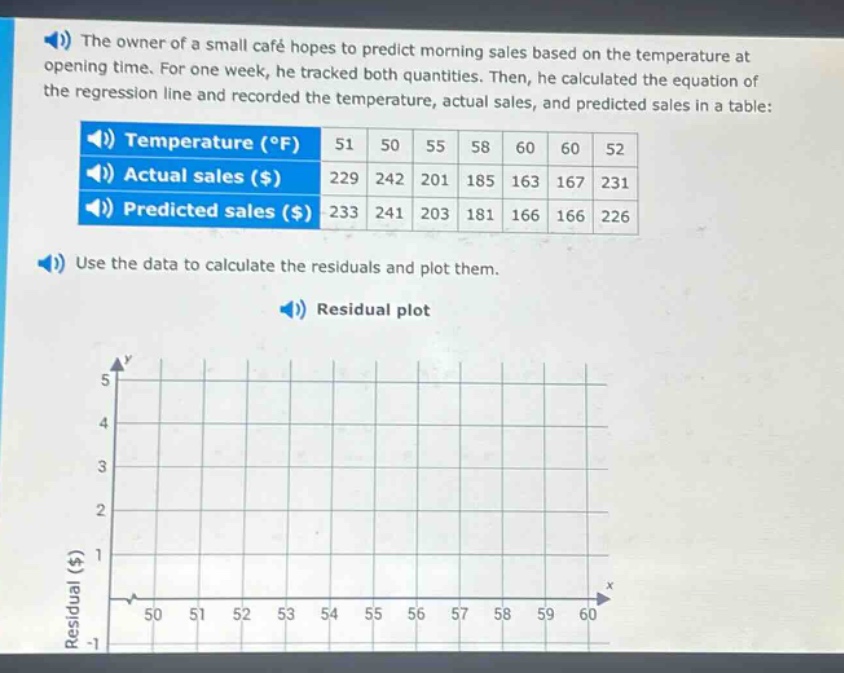
the owner of a small café hopes to predict morning sales based on the temperature at opening time. for one week, he tracked both quantities. then, he calculated the equation of the regression line and recorded the temperature, actual sales, and predicted sales in a table:\ntemperature (°f) 51 50 55 58 60 60 52\nactual sales ($) 229 242 201 185 163 167 231\npredicted sales ($) 233 241 203 181 166 166 226\nuse the data to calculate the residuals and plot them.\nresidual plot
Answer
Explanation:
Step1: Recall residual formula
Residual = Actual - Predicted
Step2: Calculate residuals for each data - point
For temperature 51: Residual = 229 - 233=-4 For temperature 50: Residual = 242 - 241 = 1 For temperature 55: Residual = 201 - 203=-2 For temperature 58: Residual = 185 - 181 = 4 For temperature 60: Residual = 163 - 166=-3 For temperature 60: Residual = 167 - 166 = 1 For temperature 52: Residual = 231 - 226 = 5
Step3: Plot the residuals
On the x - axis, we have the temperature values (50, 51, 52, 55, 58, 60). On the y - axis, we have the residual values (-4, 1, -2, 4, -3, 1, 5). We plot each pair (temperature, residual) as a point on the residual plot.
Answer:
Residuals: -4, 1, -2, 4, -3, 1, 5. Plot points (51, - 4), (50, 1), (55, -2), (58, 4), (60, -3), (60, 1), (52, 5) on the given residual - plot graph.