how does a production possibility chart assist in outlining opportunity cost? it compares profit potential…
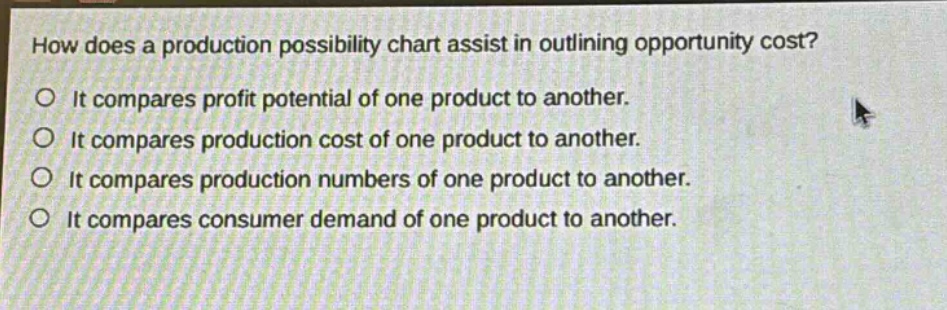
how does a production possibility chart assist in outlining opportunity cost? it compares profit potential of one product to another. it compares production cost of one product to another. it compares production numbers of one product to another. it compares consumer demand of one product to another.
Answer
Brief Explanations:
A production - possibility chart shows the different combinations of two goods that can be produced with given resources and technology. Opportunity cost is the value of the next - best alternative forgone. By comparing the production numbers of one product to another on the chart, we can see how much of one good must be given up to produce more of the other, which is the opportunity cost.
Answer:
It compares production numbers of one product to another.