read the graph. jobs created by new businesses in the us (2005–2010) what can the reader reasonably conclude…
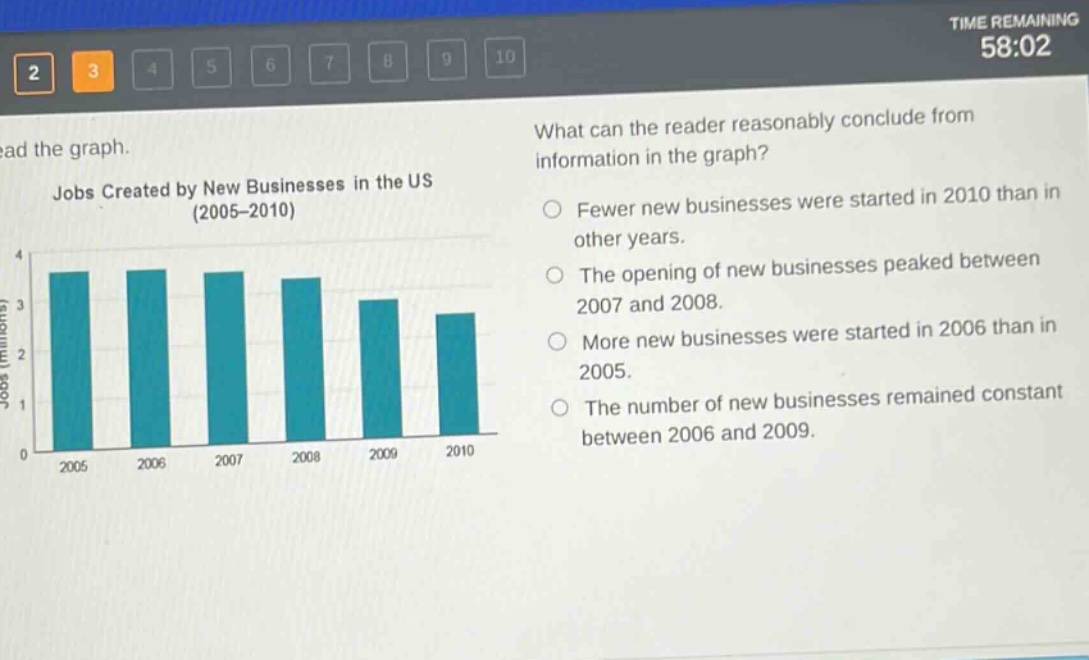
read the graph. jobs created by new businesses in the us (2005–2010) what can the reader reasonably conclude from information in the graph? fewer new businesses were started in 2010 than in other years. the opening of new businesses peaked between 2007 and 2008. more new businesses were started in 2006 than in 2005. the number of new businesses remained constant between 2006 and 2009.
Answer
Brief Explanations:
The bar - chart shows jobs created by new businesses in the US from 2005 - 2010. Analyzing the heights of the bars for each year:
- Option 1: The chart doesn't show the number of new businesses started, just jobs created, so this can't be concluded.
- Option 2: There is no indication of a peak between 2007 - 2008 as the bars are relatively similar in height.
- Option 3: Since the bar for 2006 is taller than the bar for 2005, more jobs were created by new businesses in 2006, which likely means more new businesses were started in 2006 than in 2005.
- Option 4: The bars for 2006 - 2009 have different heights, so the number of new businesses did not remain constant.
Answer:
More new businesses were started in 2006 than in 2005.