representing a graph with a function\nprofit vs. price\nwhich function represents profit, $p(x)$, as a…
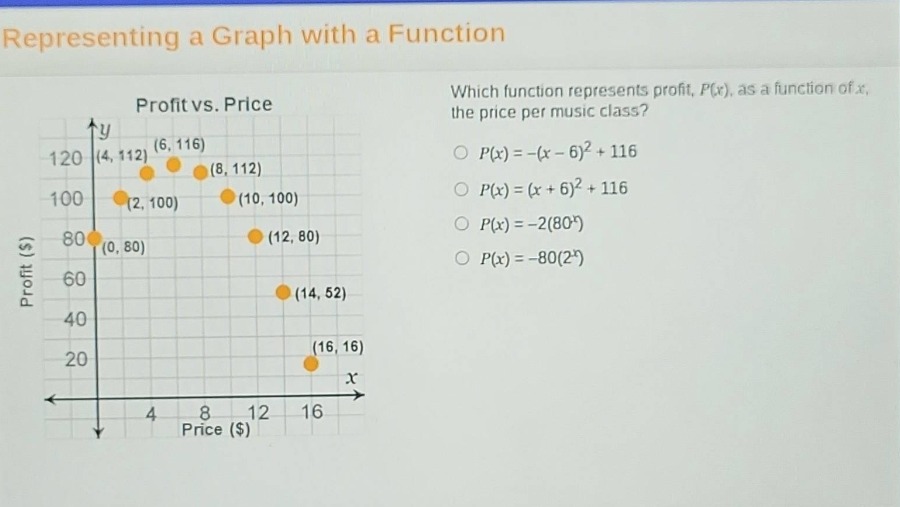
representing a graph with a function\nprofit vs. price\nwhich function represents profit, $p(x)$, as a function of $x$, the price per music class?\n$p(x)=-(x - 6)^2+116$\n$p(x)=(x + 6)^2+116$\n$p(x)=-2(80^x)$\n$p(x)=-80(2^x)$
Answer
Explanation:
Step1: Check vertex - form of quadratic function
The general vertex - form of a quadratic function is $P(x)=a(x - h)^2 + k$, where $(h,k)$ is the vertex of the parabola. By observing the graph, we can see that the vertex of the profit - price relationship seems to be around the point $(6,116)$.
Step2: Analyze the shape of the parabola
Since the parabola opens downwards (as the profit first increases and then decreases as the price $x$ increases), the coefficient $a$ of the quadratic function should be negative.
Step3: Evaluate each option
- For $P(x)=-(x - 6)^2+116$, it is in vertex - form with vertex $(6,116)$ and $a=-1$ (negative, which is consistent with the downward - opening parabola).
- For $P(x)=(x + 6)^2+116$, the vertex is $(-6,116)$ which is not correct according to the graph.
- For $P(x)=-2(80^x)$, this is an exponential function, and the graph of an exponential function does not match the parabolic shape of the given data points.
- For $P(x)=-80(2^x)$, this is also an exponential function, and its shape does not match the parabolic shape of the given data points.
Answer:
$P(x)=-(x - 6)^2+116$