“a” represents the new quantity supplied, while “b” represents the new quantity demanded. what is the result…
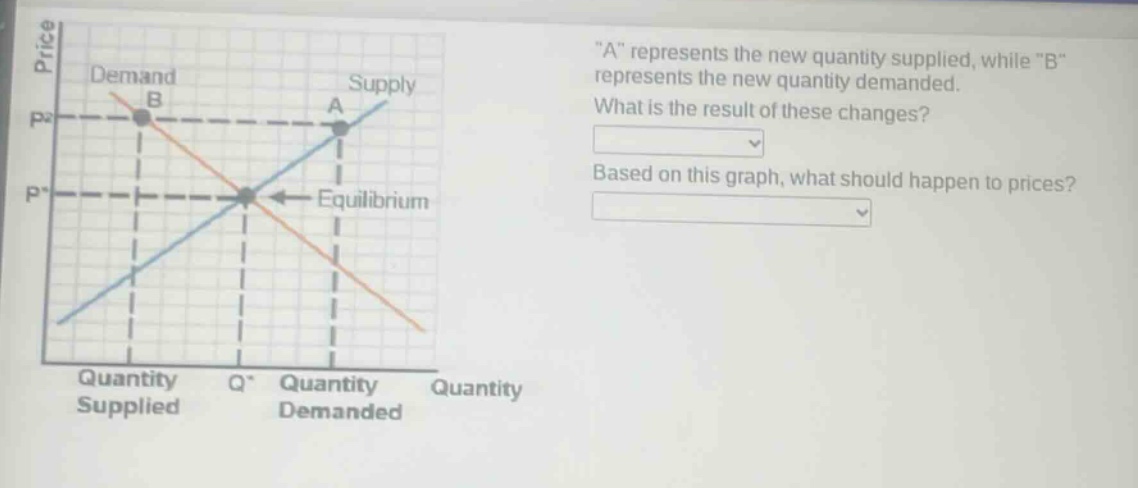
“a” represents the new quantity supplied, while “b” represents the new quantity demanded. what is the result of these changes? based on this graph, what should happen to prices?
Answer
Explanation:
Step1: Analyze quantity - supply and demand
At price $P_2$, quantity supplied (A) is greater than quantity demanded (B).
Step2: Determine market situation
This creates a surplus in the market.
Step3: Understand price - adjustment mechanism
In case of a surplus, sellers will lower prices to sell off excess inventory.
Answer:
Result of changes: Surplus What should happen to prices: Decrease