review the graph. what does the dot on the graph represent? the substitution price the equilibrium price the…
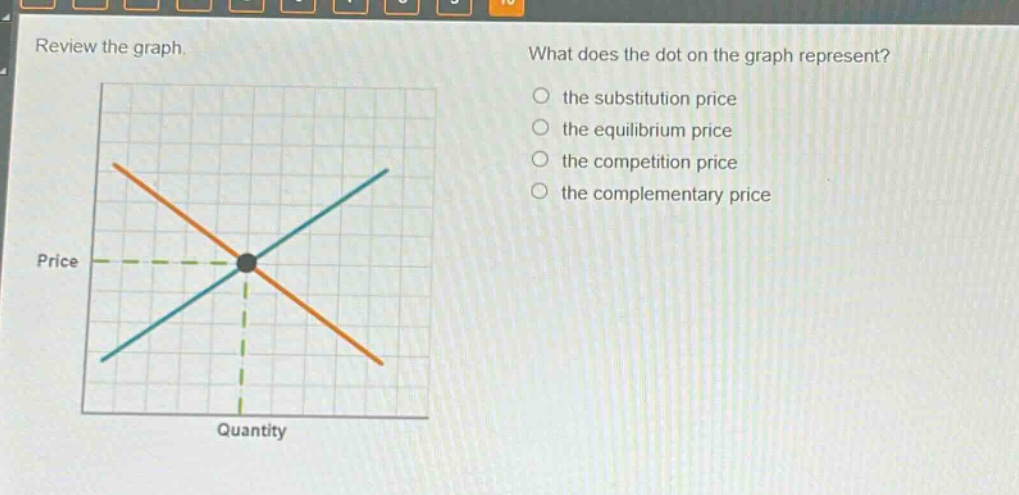
review the graph. what does the dot on the graph represent? the substitution price the equilibrium price the competition price the complementary price price quantity
Answer
Answer:
the equilibrium price
Brief Explanation:
The dot is at the intersection of supply - demand curves, which defines equilibrium price.