review the graph. what does the graph show? a supply curve a supply schedule a demand curve a demand…
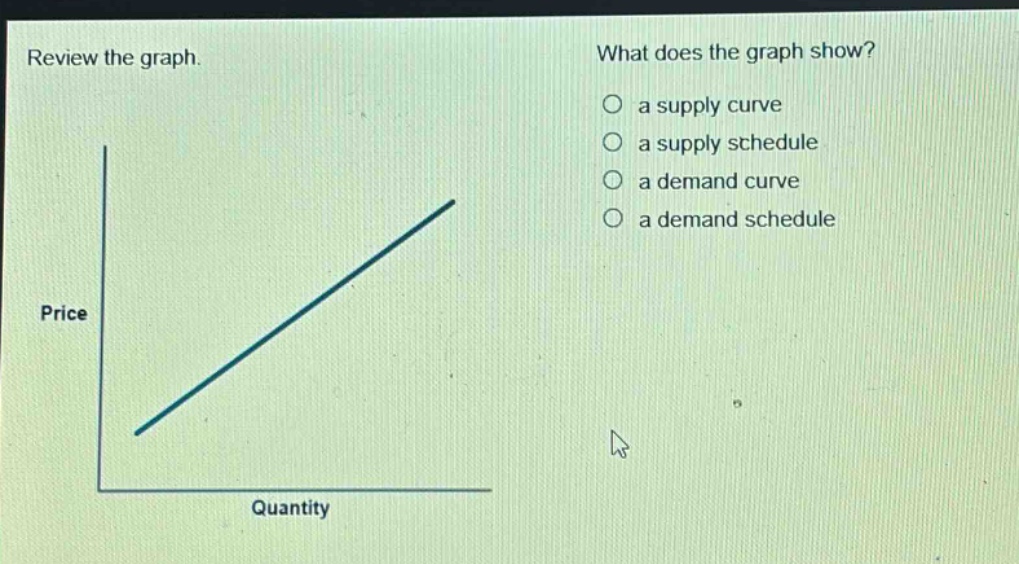
review the graph. what does the graph show? a supply curve a supply schedule a demand curve a demand schedule price quantity
Answer
Brief Explanations:
In economics, a supply - curve shows the relationship between the price of a good and the quantity supplied, with a positive slope. A demand - curve has a negative slope. A supply or demand schedule is a table, not a graph. Since the graph has a positive slope showing price and quantity relationship, it is a supply curve.
Answer:
a supply curve