review the graph, which shows data for us gdp per capita from 2010 through 2019, adjusted for inflation…
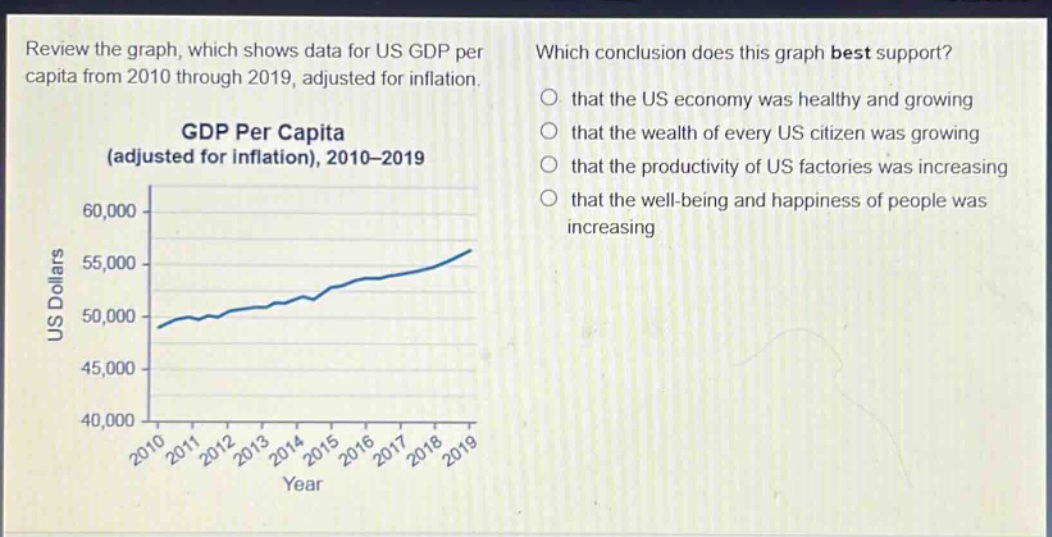
review the graph, which shows data for us gdp per capita from 2010 through 2019, adjusted for inflation. which conclusion does this graph best support? that the us economy was healthy and growing that the wealth of every us citizen was growing that the productivity of us factories was increasing that the well - being and happiness of people was increasing gdp per capita (adjusted for inflation), 2010 - 2019
Answer
Brief Explanations:
GDP per - capita is an economic indicator. An upward - trending GDP per capita adjusted for inflation generally indicates a growing economy. It doesn't mean every citizen's wealth is growing (income inequality exists), nor does it directly show factory productivity or people's well - being and happiness.
Answer:
that the US economy was healthy and growing