select the correct answer from each drop - down menu. bradley is preparing a presentation to show the ceo of…
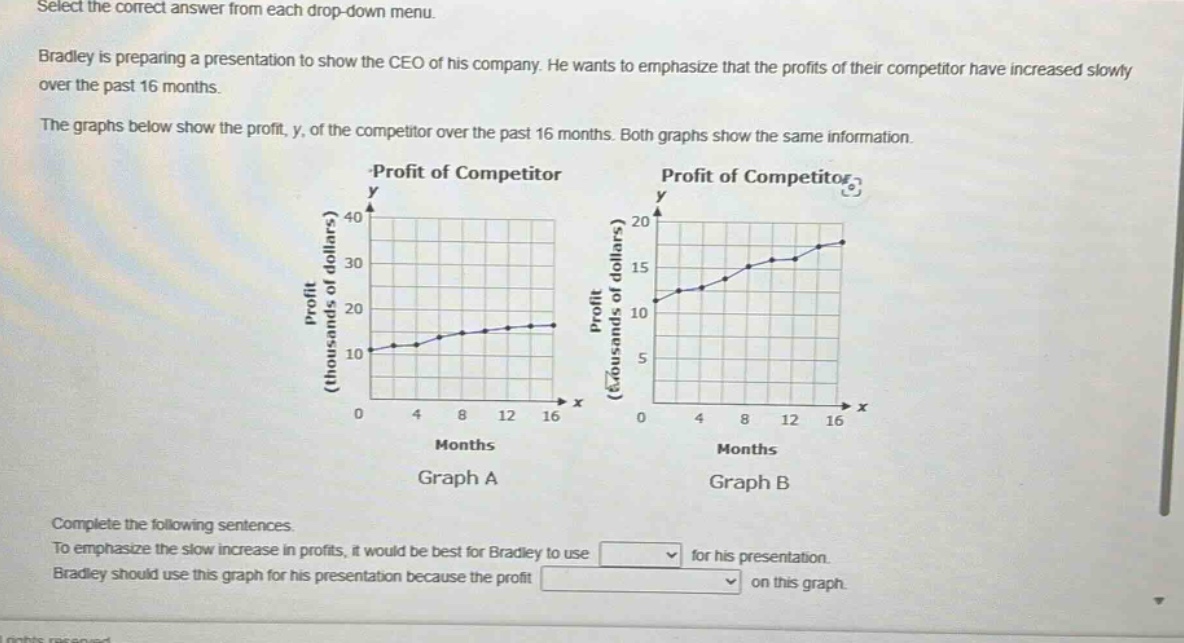
select the correct answer from each drop - down menu. bradley is preparing a presentation to show the ceo of his company. he wants to emphasize that the profits of their competitor have increased slowly over the past 16 months. the graphs below show the profit, y, of the competitor over the past 16 months. both graphs show the same information. complete the following sentences. to emphasize the slow increase in profits, it would be best for bradley to use drop - down for his presentation. bradley should use this graph for his presentation because the profit drop - down on this graph.
Answer
Explanation:
Step1: Analyze the visual - impact of graphs
Graph A has a larger y - axis range (0 - 40 thousand dollars) compared to Graph B (0 - 20 thousand dollars). When the y - axis range is larger, the same increase in profit appears less steep.
Step2: Determine the appropriate graph
To emphasize a slow increase in profits, a graph that makes the increase look less steep is better. So, Graph A is more suitable. In Graph A, the profit appears to increase more gradually because of the larger y - axis scale.
Answer:
To emphasize the slow increase in profits, it would be best for Bradley to use Graph A for his presentation. Bradley should use this graph for his presentation because the profit appears to increase more gradually on this graph.