select the correct answer. look at the graph below. price of pumpkins based on the graph, which of the…
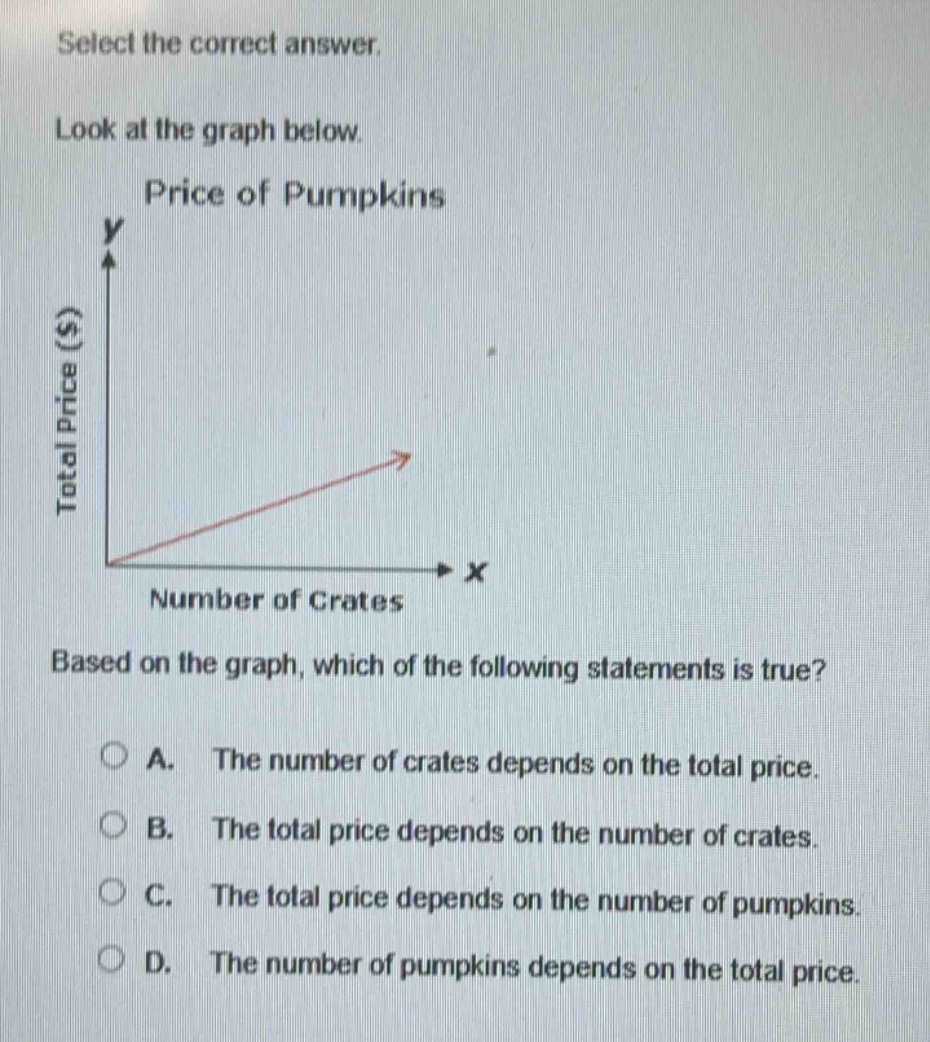
select the correct answer. look at the graph below. price of pumpkins based on the graph, which of the following statements is true? a. the number of crates depends on the total price. b. the total price depends on the number of crates. c. the total price depends on the number of pumpkins. d. the number of pumpkins depends on the total price.
Answer
Brief Explanations:
In a graph where the x - axis represents the number of crates and the y - axis represents the total price, the total price is the dependent variable and the number of crates is the independent variable. The value of the total price changes based on the number of crates.
Answer:
B. The total price depends on the number of crates.