select the correct location on the graph. choose the point on the graph that shows an excess supply of labor…
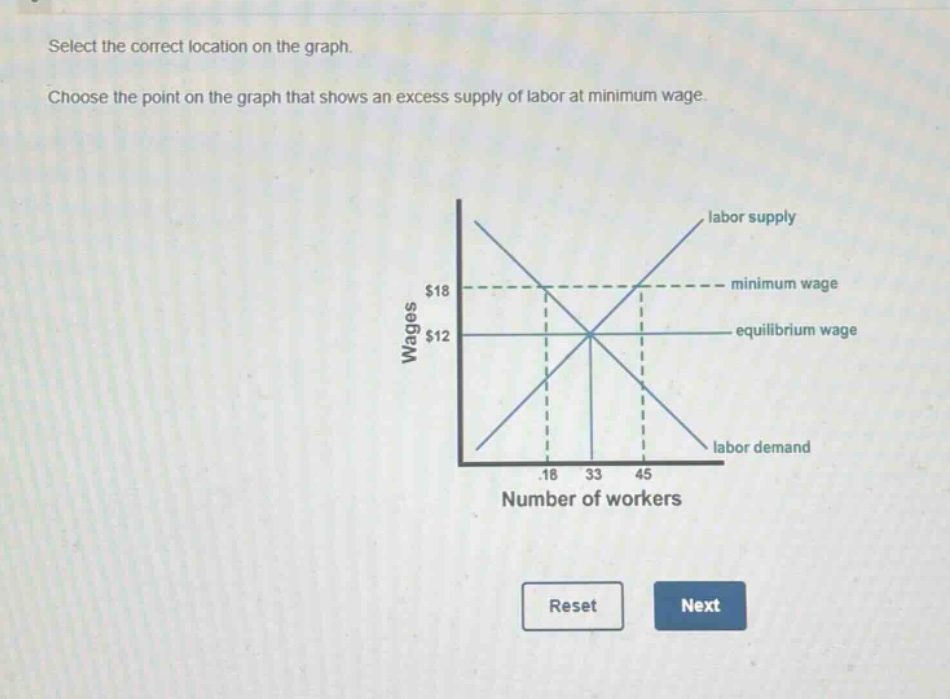
select the correct location on the graph. choose the point on the graph that shows an excess supply of labor at minimum wage.
Answer
Explanation:
Step1: Understand excess - supply concept
Excess supply occurs when quantity supplied is greater than quantity demanded.
Step2: Locate minimum - wage line
The minimum - wage is at $18.
Step3: Find quantity supplied and demanded at minimum wage
At the minimum wage of $18, the labor - supply curve shows a quantity of 45 workers and the labor - demand curve shows a quantity of 18 workers.
Answer:
The point on the graph where the labor - supply curve intersects the minimum - wage line (at a wage of $18 and a quantity of 45 workers) represents an excess supply of labor at the minimum wage.