select the correct point on the graph. which point on the graph indicates the lowest quantity supplied of…
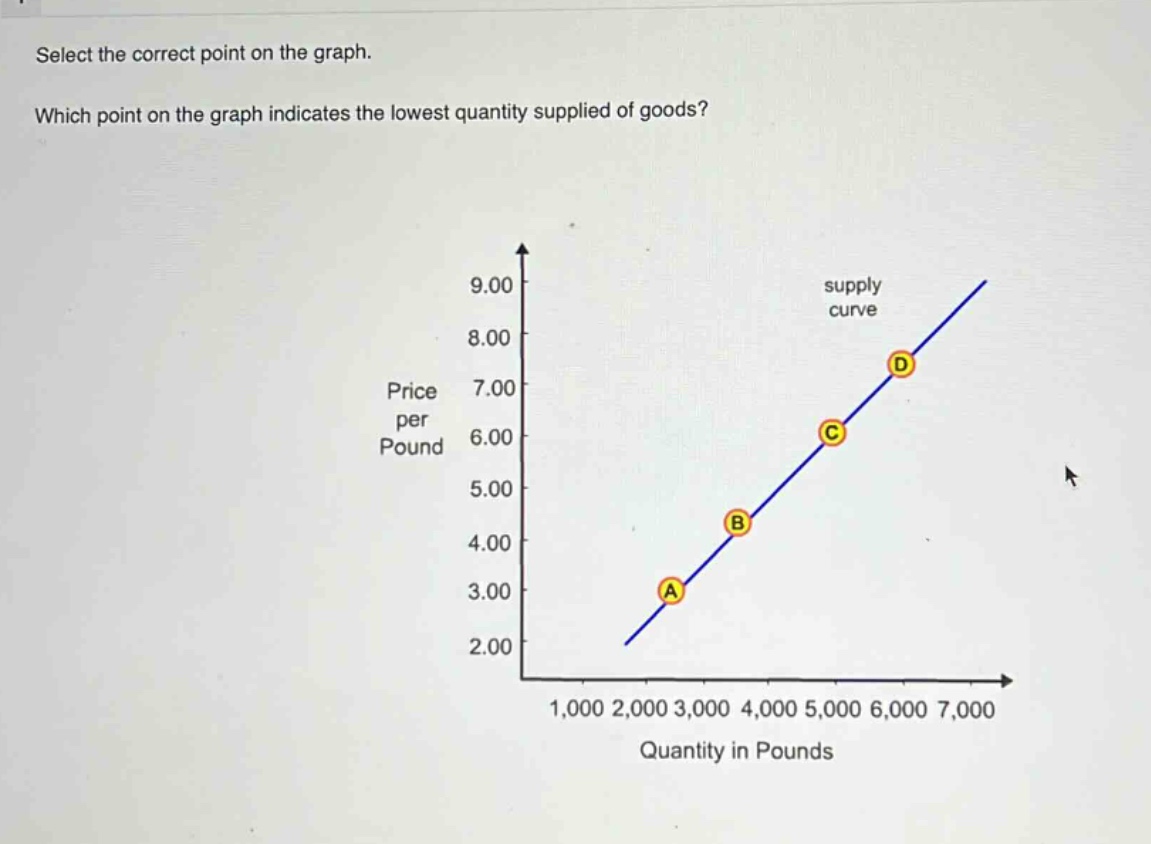
select the correct point on the graph. which point on the graph indicates the lowest quantity supplied of goods?
Answer
Answer:
A. Punto A
Explanation:
Step1: Analizar la gráfica
La gráfica muestra la curva de oferta con puntos A, B, C y D.
Step2: Identificar la cantidad
Observamos la cantidad en el eje - horizontal para cada punto.
Step3: Determinar el menor valor
El punto A tiene la menor cantidad en el eje de la cantidad (aproximadamente 3000 libras), mientras que B, C y D tienen cantidades mayores.