which statement best describes the trends shown in the graph?\nas the highest tax rate was reduced in the…
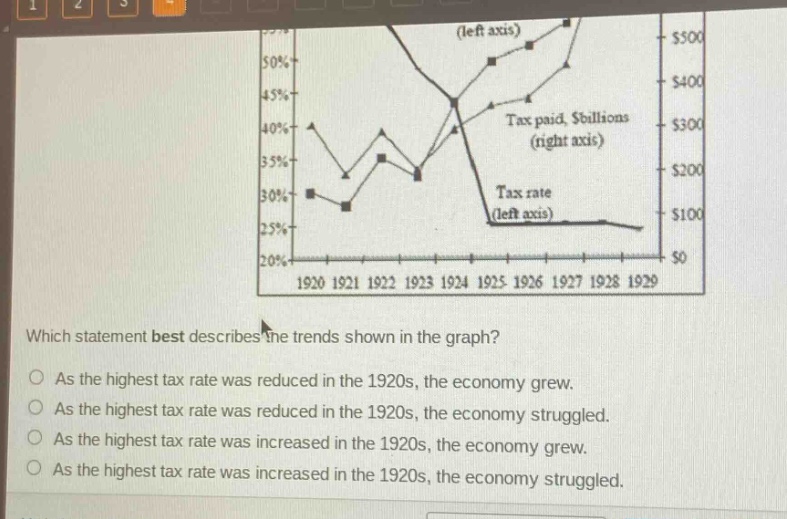
which statement best describes the trends shown in the graph?\nas the highest tax rate was reduced in the 1920s, the economy grew.\nas the highest tax rate was reduced in the 1920s, the economy struggled.\nas the highest tax rate was increased in the 1920s, the economy grew.\nas the highest tax rate was increased in the 1920s, the economy struggled.
Answer
Brief Explanations:
By observing the graph, we can see that the tax rate decreased in the 1920s and the amount of tax paid (which can be an indicator of economic activity to some extent) increased. This implies that as the highest - tax rate was reduced, the economy grew.
Answer:
As the highest tax rate was reduced in the 1920s, the economy grew.