which statement does the information in the charts support? select all that apply. the share of world gdp…
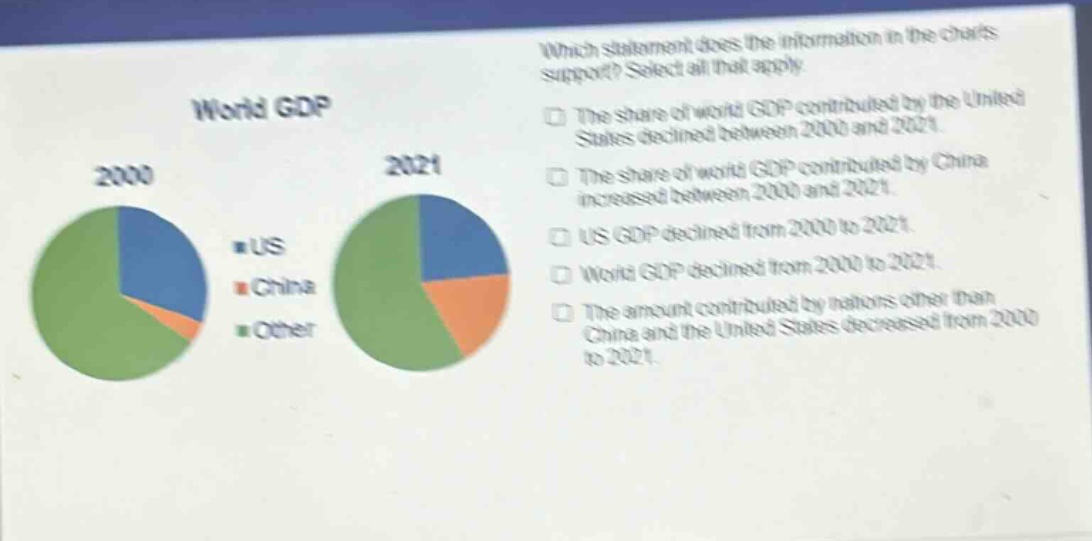
which statement does the information in the charts support? select all that apply. the share of world gdp contributed by the united states declined between 2000 and 2021. the share of world gdp contributed by china increased between 2000 and 2021. us gdp declined from 2000 to 2021. world gdp declined from 2000 to 2021. the amount contributed by nations other than china and the united states decreased from 2000 to 2021.
Answer
Brief Explanations:
By observing the pie - charts of world GDP in 2000 and 2021, the US - share in world GDP is smaller in 2021 compared to 2000, and China's share is larger in 2021. The absolute values of US GDP and world GDP are not given, so we can't say they declined. The "Other" category's share decreased, but we don't know if the amount decreased without knowing the total world GDP value.
Answer:
The share of world GDP contributed by the United States declined between 2000 and 2021. The share of world GDP contributed by China increased between 2000 and 2021.