which statement is true of the graph on the right? the average salary doubled between year 1 and 2. the…
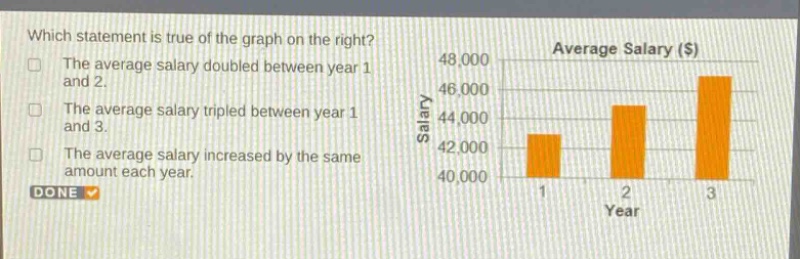
which statement is true of the graph on the right? the average salary doubled between year 1 and 2. the average salary tripled between year 1 and 3. the average salary increased by the same amount each year. done
Answer
Explanation:
Step1: Analyze first - statement
Let the salary in year 1 be $s_1 = 43000$, and in year 2 be $s_2=45000$. Since $\frac{s_2}{s_1}=\frac{45000}{43000}\neq2$, the average salary did not double between year 1 and 2.
Step2: Analyze second - statement
The salary in year 1 is $s_1 = 43000$ and in year 3 is $s_3 = 47000$. Since $\frac{s_3}{s_1}=\frac{47000}{43000}\neq3$, the average salary did not triple between year 1 and 3.
Step3: Analyze third - statement
The increase from year 1 to year 2 is $45000 - 43000=2000$. The increase from year 2 to year 3 is $47000 - 45000 = 2000$. The average salary increased by the same amount each year.
Answer:
The average salary increased by the same amount each year.