which statement is true of the graph on the right? the average salary doubled between year 1 and 2. the…
which statement is true of the graph on the right? the average salary doubled between year 1 and 2. the average salary tripled between year 1 and 3. the average salary increased by the same amount each year. complete why is the graph misleading? the horizontal axis does not begin at zero. the vertical axis does not begin at zero. the horizontal scale changes. the vertical scale changes.
Answer
Brief Explanations:
- Analyzing the first part:
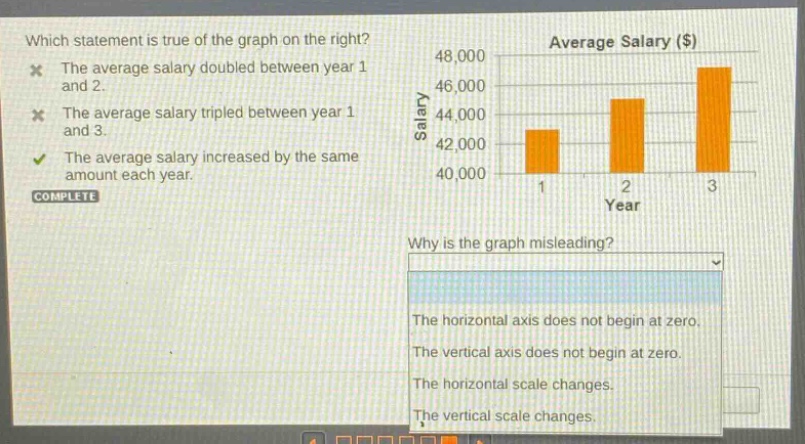
- For the statement about doubling between year 1 and 2, if the salary in year 1 is around $43,000 and in year 2 is around $45,000, it didn't double.
- For the statement about tripling between year 1 and 3, with year - 1 salary around $43,000 and year - 3 salary around $47,000, it didn't triple.
- By observing the differences in salary values between consecutive years, the increase is approximately the same amount each year.
- Analyzing the second part:
- The graph is misleading because the vertical axis does not begin at zero. Starting the vertical axis at $40,000 exaggerates the differences in the average salaries between the years.
Answer:
- The average salary increased by the same amount each year.
- The vertical axis does not begin at zero.