study the following production possibility curve. the number of data points that illustrate the proper…
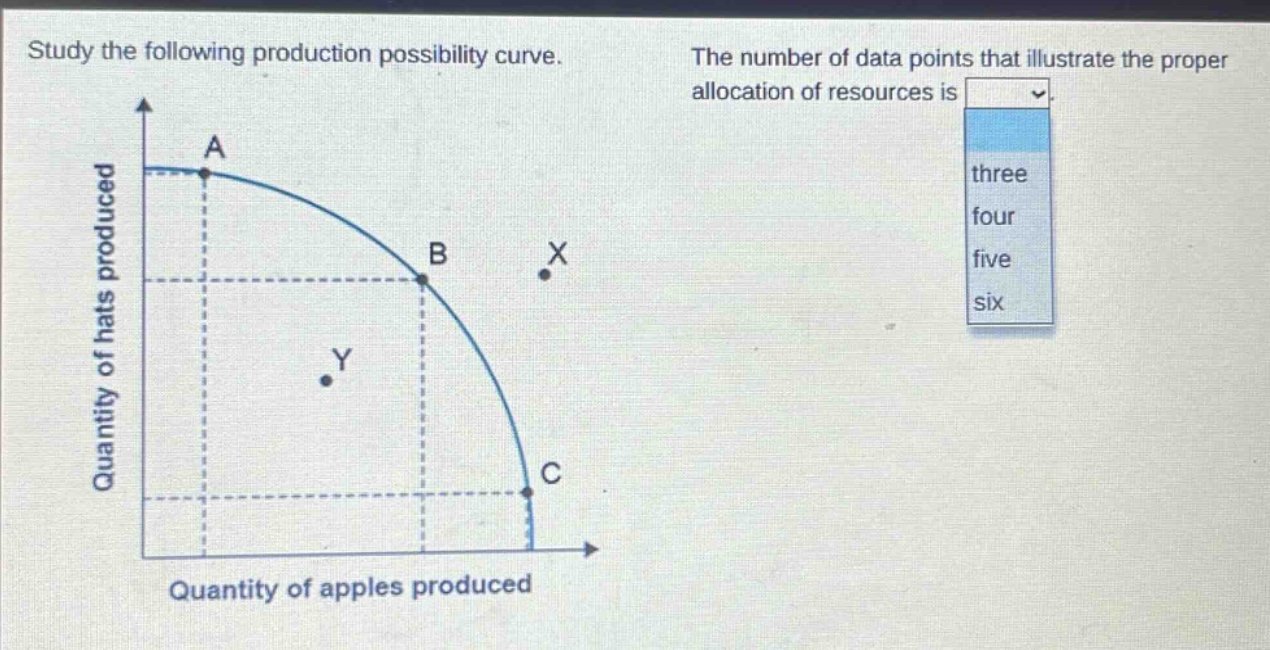
study the following production possibility curve. the number of data points that illustrate the proper allocation of resources is three four five six quantity of hats produced quantity of apples produced
Answer
Brief Explanations:
Points on the production - possibility curve (A, B, C) represent efficient allocation of resources. Points inside (Y) represent under - utilization and points outside (X) are unattainable with current resources. So, the points on the curve (3 points: A, B, C) illustrate proper resource allocation.
Answer:
three