study the graph below\npercent change in real gross domestic product (gdp)\nwhich of these best…
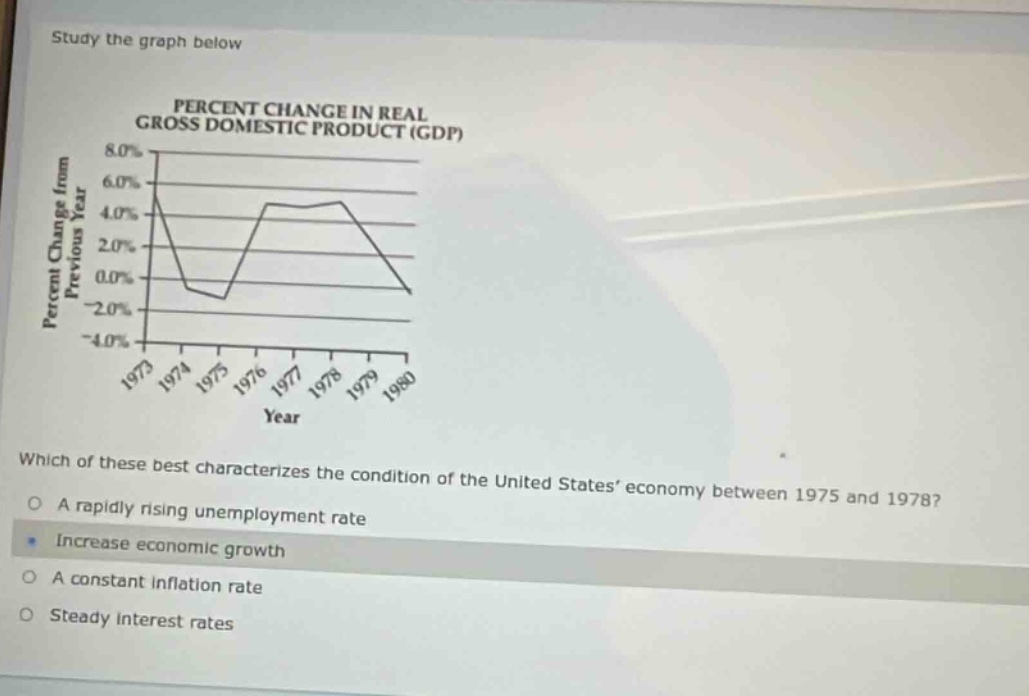
study the graph below\npercent change in real gross domestic product (gdp)\nwhich of these best characterizes the condition of the united states’ economy between 1975 and 1978?\na rapidly rising unemployment rate\nincrease economic growth\na constant inflation rate\nsteady interest rates
Answer
Answer:
Increase economic growth
Brief Explanations:
The graph shows positive percent - change in real GDP from 1975 to 1978, indicating economic growth.