supply and demand curves\nsupply and demand equilibrium\nmatch each term with the correct part of the…
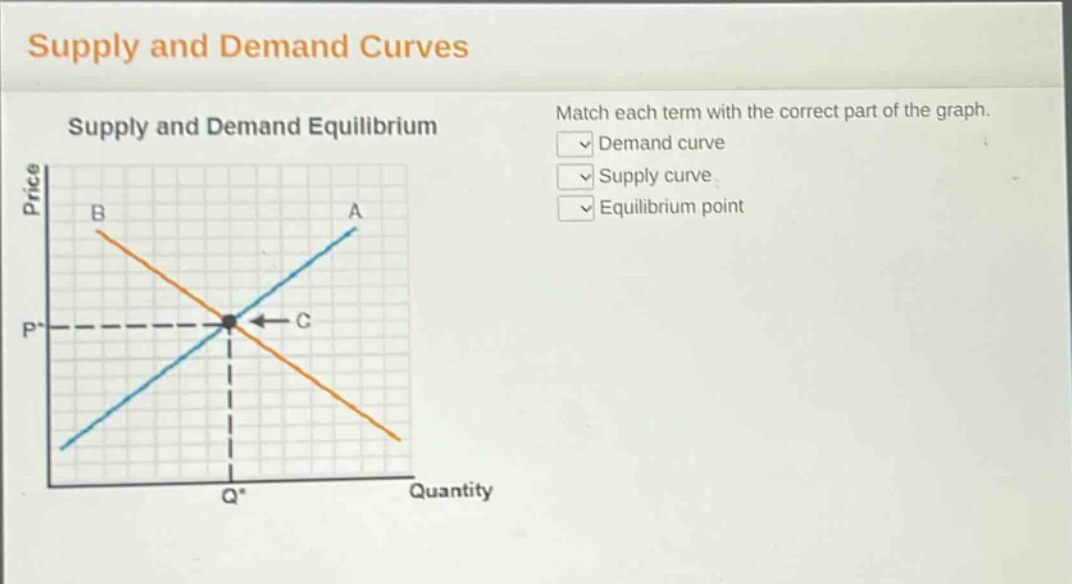
supply and demand curves\nsupply and demand equilibrium\nmatch each term with the correct part of the graph.\ndemand curve\nsupply curve\nequilibrium point
Answer
Brief Explanations:
In a supply - and - demand graph, the demand curve is downward - sloping representing the inverse relationship between price and quantity demanded. The supply curve is upward - sloping showing the positive relationship between price and quantity supplied. The equilibrium point is where the supply and demand curves intersect.
Answer:
Demand curve: B Supply curve: A Equilibrium point: C