supply and demand equilibrium which change is illustrated by the shift taking place on this graph? a…
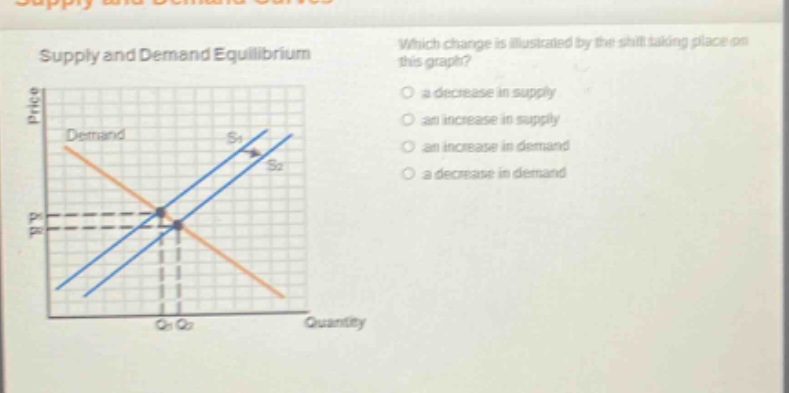
supply and demand equilibrium which change is illustrated by the shift taking place on this graph? a decrease in supply an increase in supply an increase in demand a decrease in demand
Answer
Brief Explanations:
In supply - demand graphs, a left - ward shift of the supply curve represents a decrease in supply. Here, the supply curve shifts from $S_0$ to $S_1$ to the left.
Answer:
a decrease in supply