supply and demand equilibrium\nwhat change is taking place on this graph?\n○ a decrease in supply\n○ a…
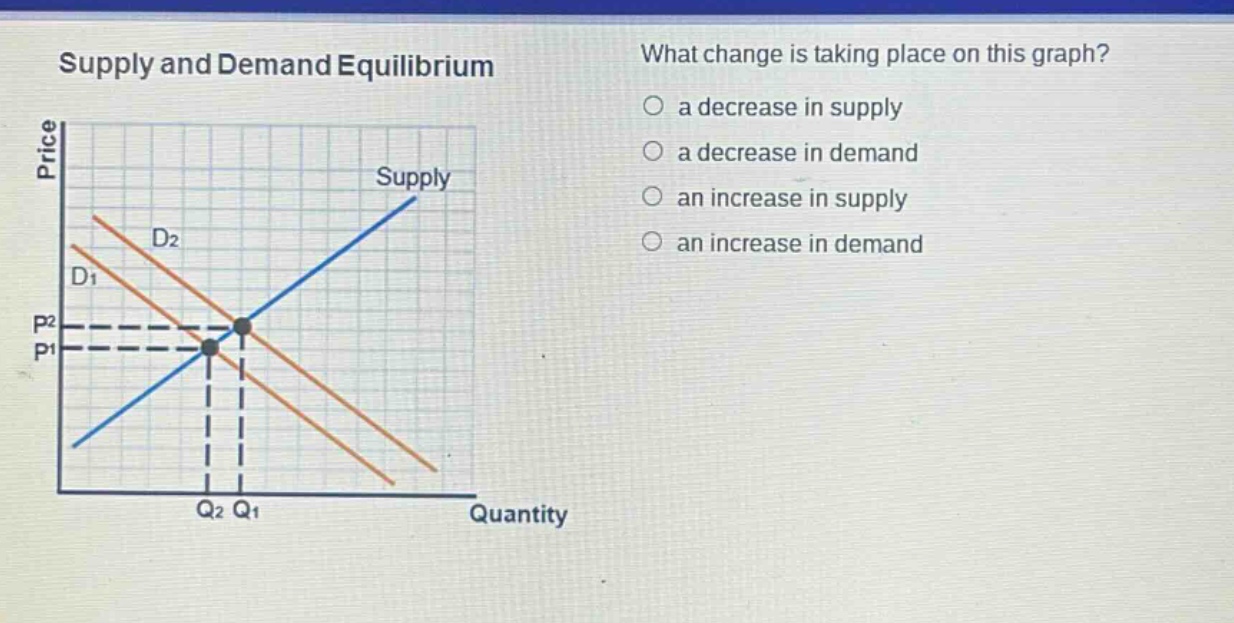
supply and demand equilibrium\nwhat change is taking place on this graph?\n○ a decrease in supply\n○ a decrease in demand\n○ an increase in supply\n○ an increase in demand
Answer
Brief Explanations:
In a supply - demand graph, when the demand curve shifts to the right (from D1 to D2 in this case), it represents an increase in demand. The equilibrium price and quantity both increase as a result. Here, the demand curve has shifted rightward, indicating more quantity demanded at each price level.
Answer:
an increase in demand