the table compares two countries and two products. what might be the best decision for country a?\n| country…
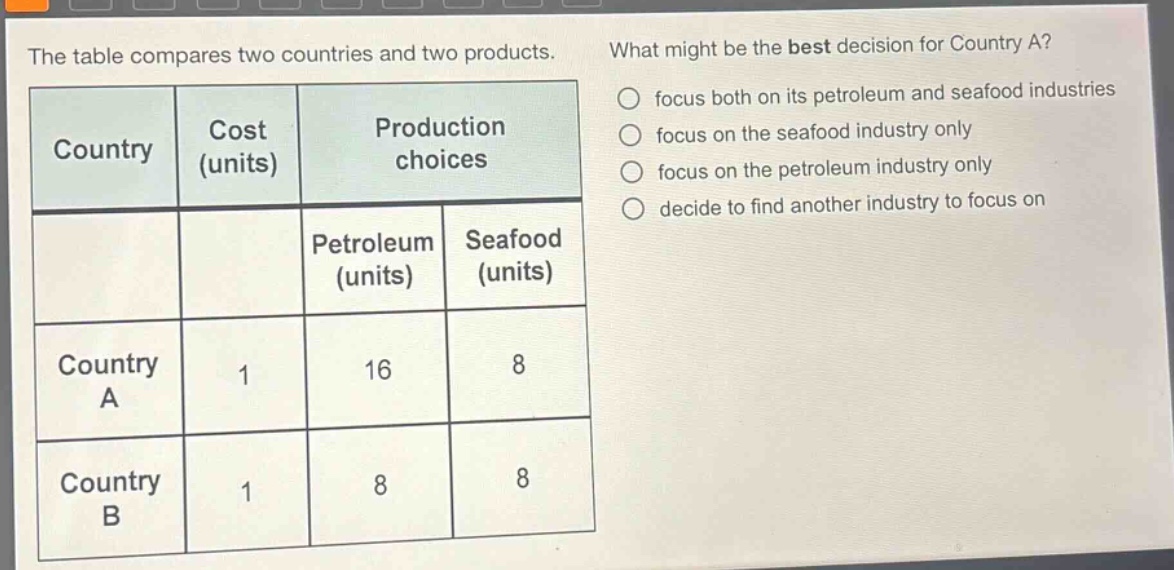
the table compares two countries and two products. what might be the best decision for country a?\n| country | cost (units) | production choices |\n| ---- | ---- | ---- |\n| | | petroleum (units) | seafood (units) |\n| country a | 1 | 16 | 8 |\n| country b | 1 | 8 | 8 |\nfocus both on its petroleum and seafood industries\nfocus on the seafood industry only\nfocus on the petroleum industry only\ndecide to find another industry to focus on
Answer
Explanation:
Step 1: Calculate opportunity costs for Country A
Opportunity cost of 1 unit petroleum: $\frac{8}{16} = 0.5$ units seafood
Opportunity cost of 1 unit seafood: $\frac{16}{8} = 2$ units petroleum
Step 2: Compare with Country B's opportunity costs (1 unit petroleum = 1 unit seafood)
Country A has lower opportunity cost for petroleum (0.5 < 1), indicating comparative advantage in petroleum.
Answer:
focus on the petroleum industry only