total federal income taxes paid 2010\naccording to the graph, how much did individuals making $20,000 to…
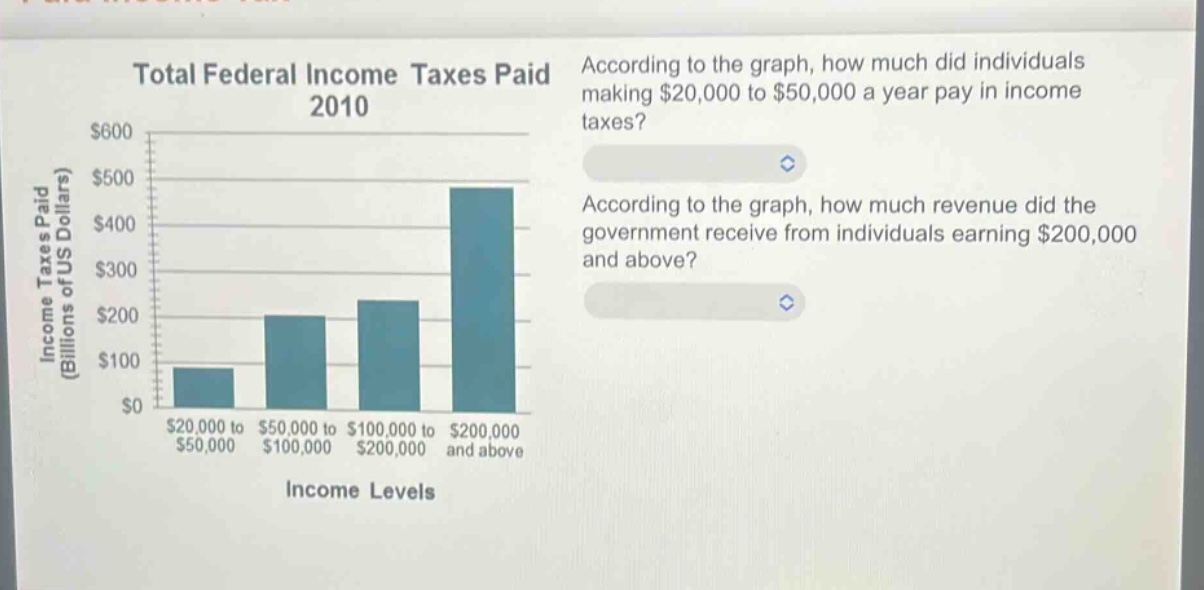
total federal income taxes paid 2010\naccording to the graph, how much did individuals making $20,000 to $50,000 a year pay in income taxes?\naccording to the graph, how much revenue did the government receive from individuals earning $200,000 and above?\nincome levels\nincome taxes paid (billions of us dollars)
Answer
Explanation:
Step1: Identify the income bracket on the graph
Locate the bar for "$20,000 to $50,000" on the x-axis.
Step2: Read the corresponding tax amount
The bar height for this bracket aligns with 100 billion US dollars on the y-axis.
Step3: Identify the higher income bracket
Locate the bar for "$200,000 and above" on the x-axis.
Step4: Read the corresponding revenue amount
The bar height for this bracket aligns with 500 billion US dollars on the y-axis.
Answer:
Individuals making $20,000 to $50,000 paid $100 billion in income taxes.
The government received $500 billion in revenue from individuals earning $200,000 and above.