total merchandise exports (2010 - 2012)\nwhich statement most accurately describes the information presented…
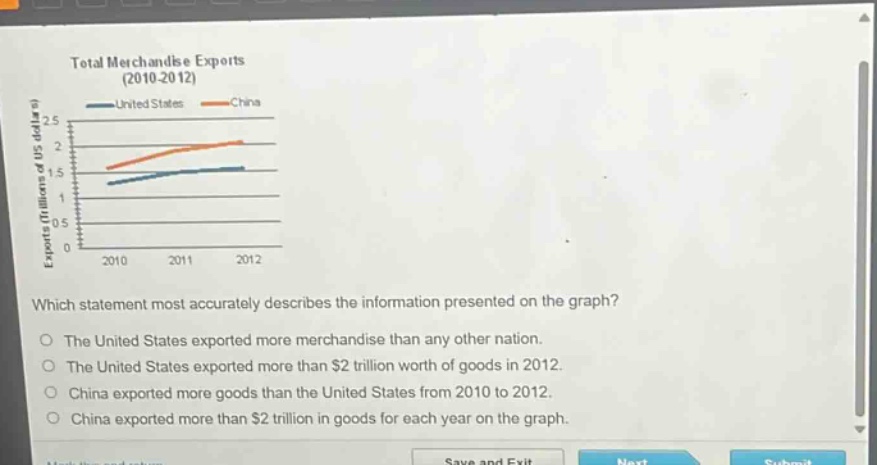
total merchandise exports (2010 - 2012)\nwhich statement most accurately describes the information presented on the graph?\nthe united states exported more merchandise than any other nation.\nthe united states exported more than $2 trillion worth of goods in 2012.\nchina exported more goods than the united states from 2010 to 2012.\nchina exported more than $2 trillion in goods for each year on the graph.
Answer
Explanation:
Step1: Analyze first option
The graph only shows US and China, not all nations, so we can't say US exported more than any other nation.
Step2: Analyze second option
From the graph, the US export value in 2012 is below 2 trillion (less than 1.5 trillion), so this is false.
Step3: Analyze third option
The orange - China's line is above the blue - US's line for 2010 - 2012, meaning China exported more goods than the US in this period.
Step4: Analyze fourth option
In 2010 and 2011, China's export value is below 2 trillion.
Answer:
China exported more goods than the United States from 2010 to 2012.