us government revenue and expenditures. 1980 - 2010\nthe graph shows the federal budget from 1980 to…
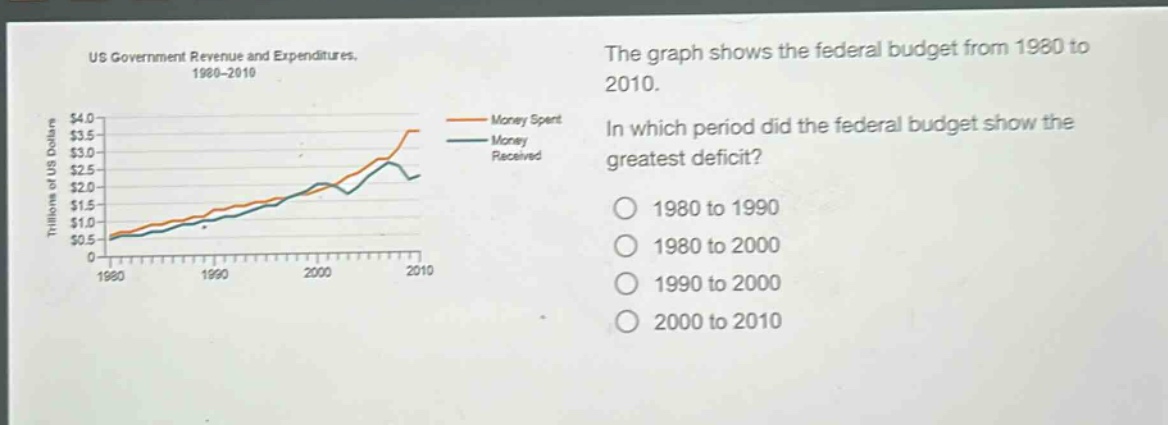
us government revenue and expenditures. 1980 - 2010\nthe graph shows the federal budget from 1980 to 2010.\nin which period did the federal budget show the greatest deficit?\n1980 to 1990\n1980 to 2000\n1990 to 2000\n2000 to 2010
Answer
Brief Explanations:
The graph displays US Government Revenue ("Money Received") and Expenditures ("Money Spent") from 1980 to 2010. A federal budget deficit occurs when expenditures exceed revenues, represented on the graph where the "Money Spent" line is above the "Money Received" line. The magnitude of the deficit corresponds to the vertical distance between these two lines. Observing the graph, the gap between the "Money Spent" line and the "Money Received" line is largest in the later years of the 2000 to 2010 period, indicating the greatest deficit during this time frame compared to the other options.
Answer:
2000 to 2010