use the drop - down menu to complete each statement. according to the chart, the percentage of people living…
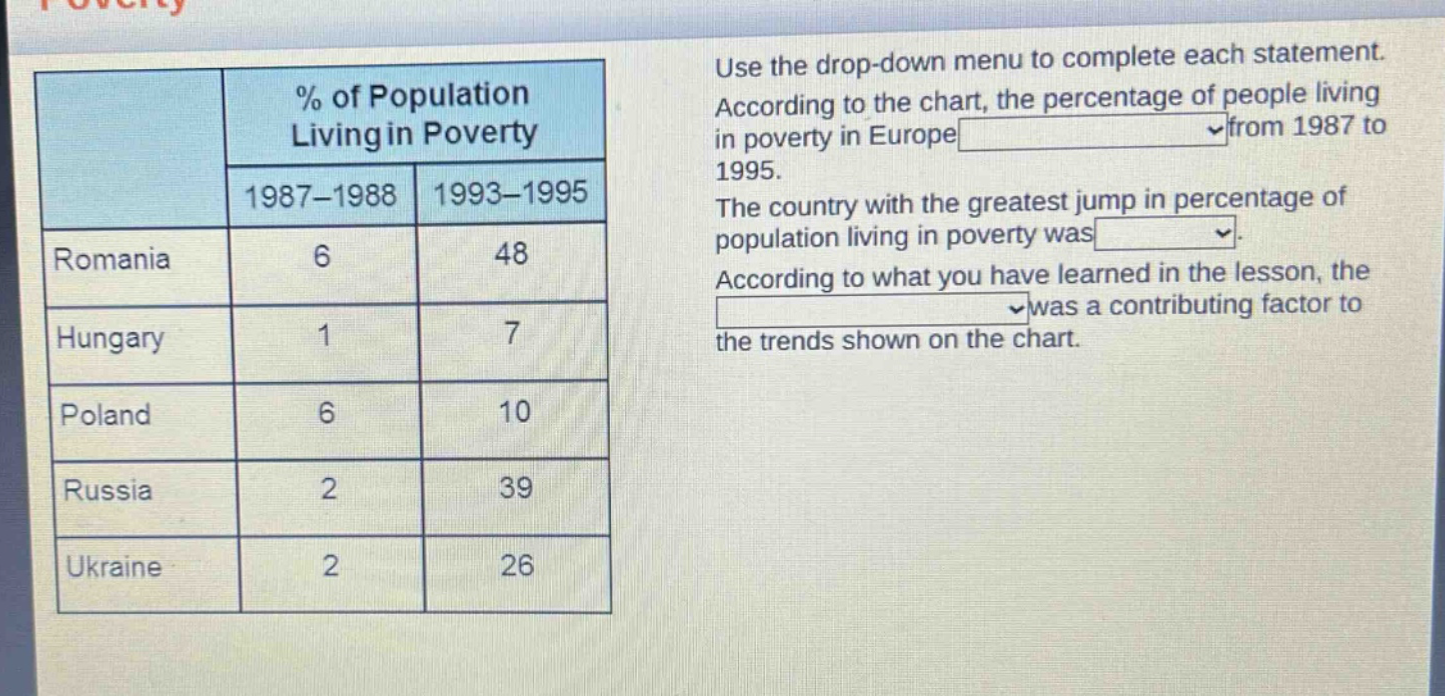
use the drop - down menu to complete each statement. according to the chart, the percentage of people living in poverty in europe from 1987 to 1995. the country with the greatest jump in percentage of population living in poverty was. according to what you have learned in the lesson, the was a contributing factor to the trends shown on the chart. % of population living in poverty 1987 - 1988 1993 - 1995 romania 6 48 hungary 1 7 poland 6 10 russia 2 39 ukraine 2 26
Answer
Brief Explanations:
- Analizamos los porcentajes de la tabla. Para Romania, el porcentaje aumentó de 6% a 48%, lo que es un aumento significativo. Esto muestra que el porcentaje de personas viviendo en pobreza en Europa aumentó en general en estos años.
- Calculamos la diferencia porcentual para cada país. Para Romania, la diferencia es 48 - 6=42; para Hungría, 7 - 1 = 6; para Polonia, 10 - 6 = 4; para Rusia, 39 - 2 = 37; para Ucrania, 26 - 2 = 24. Romania tiene la diferencia más grande.
- Los cambios políticos y económicos en Europa oriental, incluyendo la transición al capitalismo después de la caída del Muro de Berlín y la desintegración de la URSS, contribuyeron a estos cambios.
Answer:
- aumentó
- Romania
- la transición económica y política en Europa oriental