use the graph to answer the question that follows. what happens to the total quantity demanded when the…
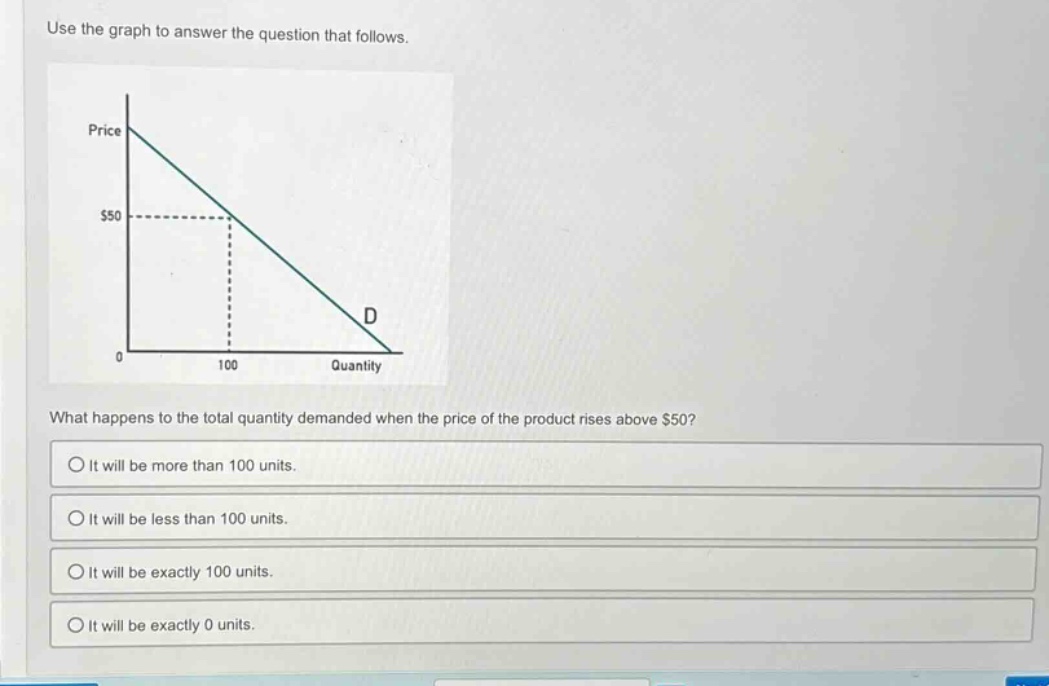
use the graph to answer the question that follows. what happens to the total quantity demanded when the price of the product rises above $50? it will be more than 100 units. it will be less than 100 units. it will be exactly 100 units. it will be exactly 0 units.
Answer
Explanation:
Step1: Analyze demand - price relationship
The demand curve shows an inverse relationship between price and quantity demanded.
Step2: Observe the graph
At a price of $50, the quantity demanded is 100 units. As price rises above $50 along the demand - curve, quantity demanded decreases.
Answer:
It will be less than 100 units.