world gdp\nwhich statement does the information in the charts support? select all that apply.\nthe share of…
world gdp\nwhich statement does the information in the charts support? select all that apply.\nthe share of world gdp contributed by the united states declined between 2000 and 2021.\nthe share of world gdp contributed by china increased between 2000 and 2021.\nus gdp declined from 2000 to 2021.\nworld gdp declined from 2000 to 2021.\nthe amount contributed by nations other than china and the united states decreased from 2000 to 2021.
Answer
Brief Explanations:
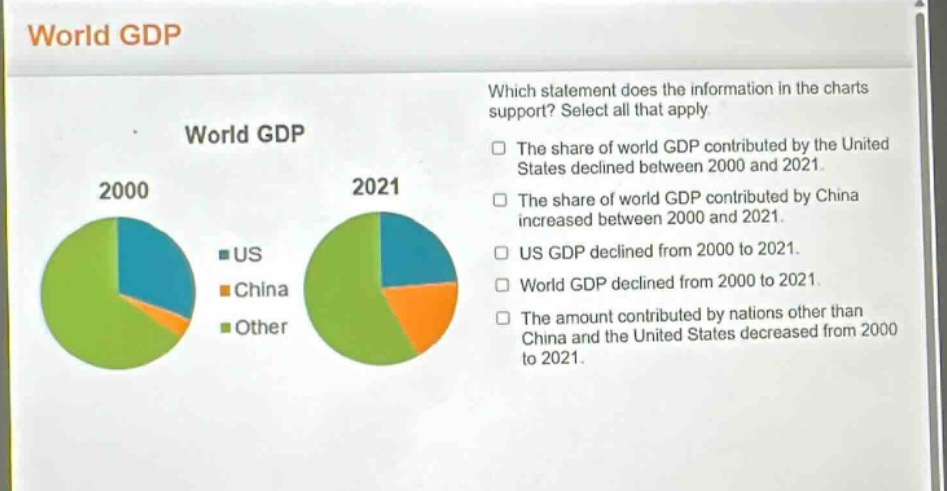
By observing the pie - charts of world GDP in 2000 and 2021, we can see that the slice representing the US in 2021 is smaller than in 2000, indicating a decline in its share. The slice for China in 2021 is larger than in 2000, showing an increase in its share. There is no indication that the US GDP or world GDP declined in absolute terms just from the share - based pie charts. Also, the "Other" category's share seems to have decreased, meaning the amount contributed by nations other than China and the US decreased in terms of share.
Answer:
The share of world GDP contributed by the United States declined between 2000 and 2021. The share of world GDP contributed by China increased between 2000 and 2021. The amount contributed by nations other than China and the United States decreased from 2000 to 2021.