this chart shows changes in how world manufacturing was distributed in 1870 and 1913. which country showed…
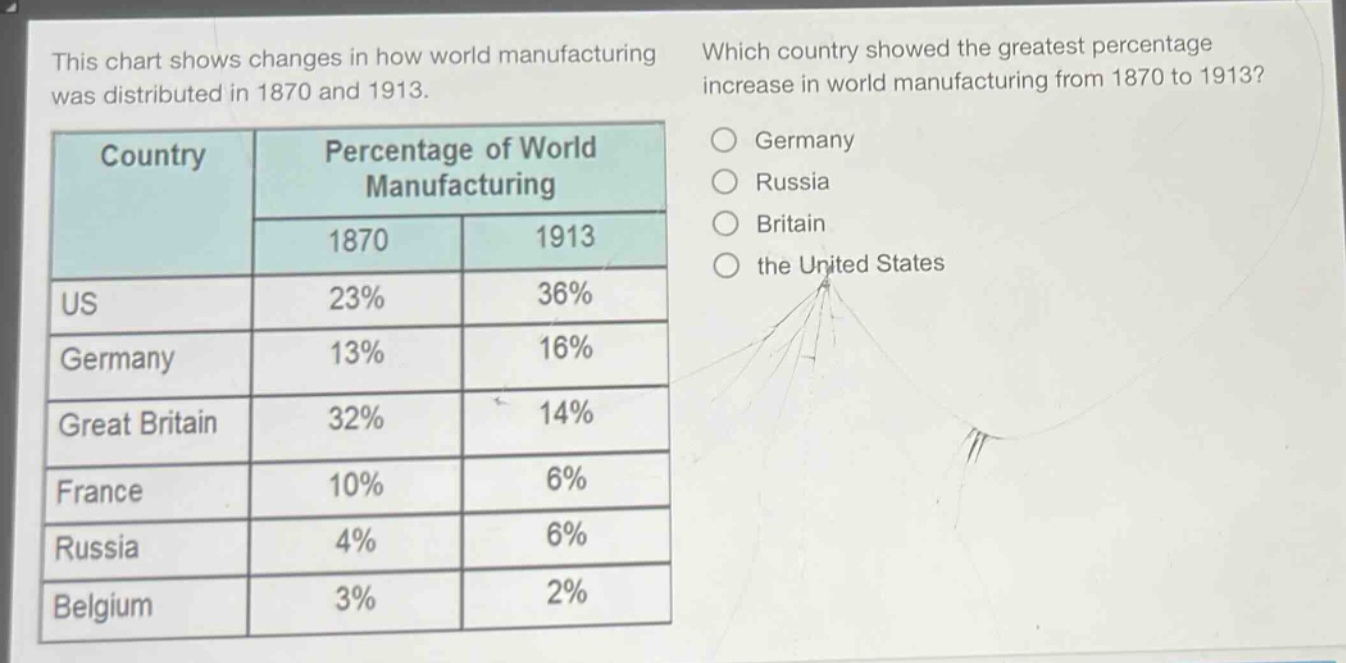
this chart shows changes in how world manufacturing was distributed in 1870 and 1913. which country showed the greatest percentage increase in world manufacturing from 1870 to 1913? country percentage of world manufacturing 1870 1913 us 23% 36% germany 13% 16% great britain 32% 14% france 10% 6% russia 4% 6% belgium 3% 2% germany russia britain the united states
Answer
Explanation:
Step1: Calculate percentage increase for Germany
Percentage increase formula is $\frac{New - Old}{Old}\times100%$. For Germany, Old = 13%, New = 16%. So, $\frac{16 - 13}{13}\times100%=\frac{3}{13}\times100%\approx 23.08%$.
Step2: Calculate percentage increase for Russia
Old = 4%, New = 6%. So, $\frac{6 - 4}{4}\times100%=\frac{2}{4}\times100% = 50%$.
Step3: Calculate percentage increase for Britain
Old = 32%, New = 14%. Since it's a decrease, we ignore it as we are looking for increase.
Step4: Calculate percentage increase for the United States
Old = 23%, New = 36%. So, $\frac{36 - 23}{23}\times100%=\frac{13}{23}\times100%\approx 56.52%$.
Answer:
D. the United States