the chart shows immigration to the united states between 1840 and 1920. immigration to the united states…
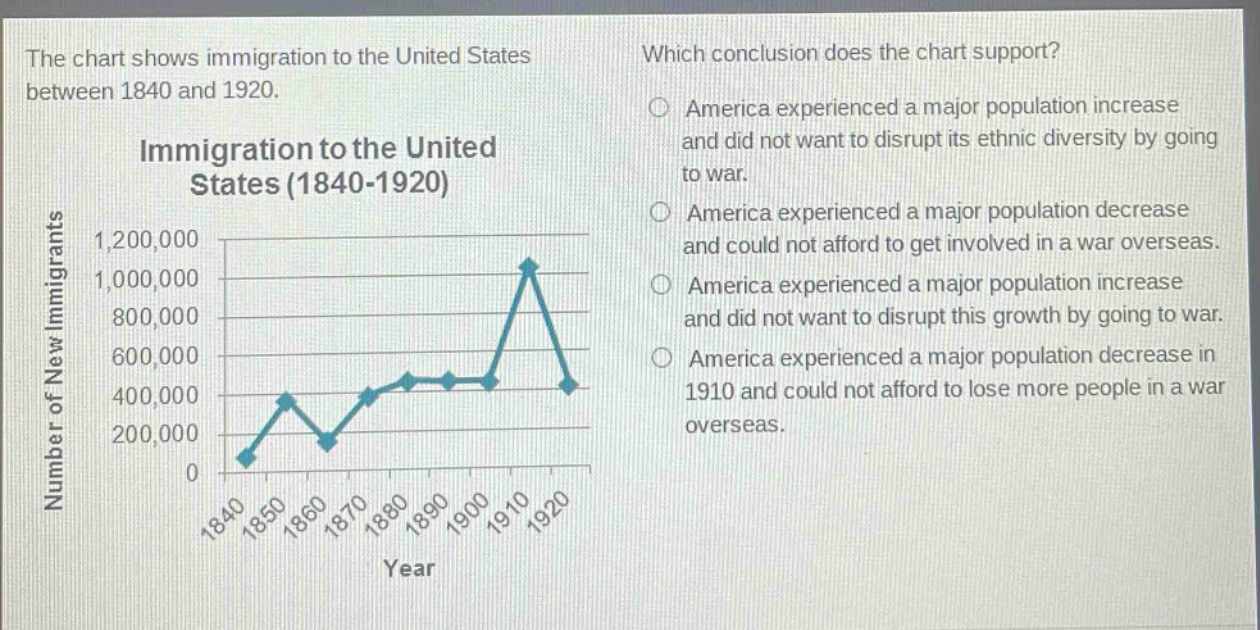
the chart shows immigration to the united states between 1840 and 1920. immigration to the united states (1840 - 1920) which conclusion does the chart support? america experienced a major population increase and did not want to disrupt its ethnic diversity by going to war. america experienced a major population decrease and could not afford to get involved in a war overseas. america experienced a major population increase and did not want to disrupt this growth by going to war. america experienced a major population decrease in 1910 and could not afford to lose more people in a war overseas.
Answer
Brief Explanations:
The chart shows an overall increase in the number of new immigrants to the US between 1840 - 1920. A major population increase from immigration would make the country reluctant to disrupt this growth through war.
Answer:
America experienced a major population increase and did not want to disrupt this growth by going to war.