the graph shows troop casualties in major pacific battles. what does the graph show about american…
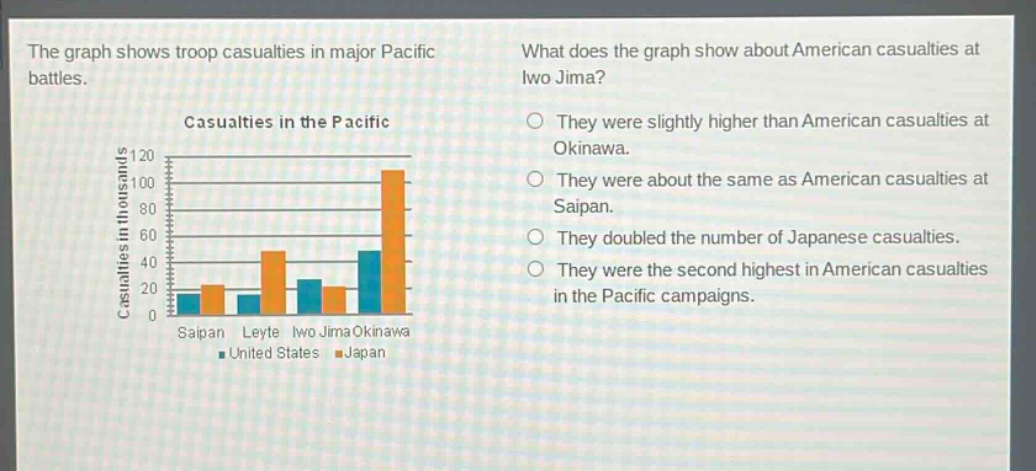
the graph shows troop casualties in major pacific battles. what does the graph show about american casualties at iwo jima? they were slightly higher than american casualties at okinawa. they were about the same as american casualties at saipan. they doubled the number of japanese casualties. they were the second highest in american casualties in the pacific campaigns. casualties in the pacific casualties in thousands 120 100 80 60 40 20 0 saipan leyte iwo jima okinawa united states japan
Answer
Brief Explanations:
By observing the bar - graph, we can see the height of the blue bar (representing US casualties) for Iwo Jima is second only to the blue bar for Okinawa among the battles shown.
Answer:
They were the second highest in American casualties in the Pacific campaigns.