the line graph shows us defense spending from 1946 to 1968. which of the following statements best explains…
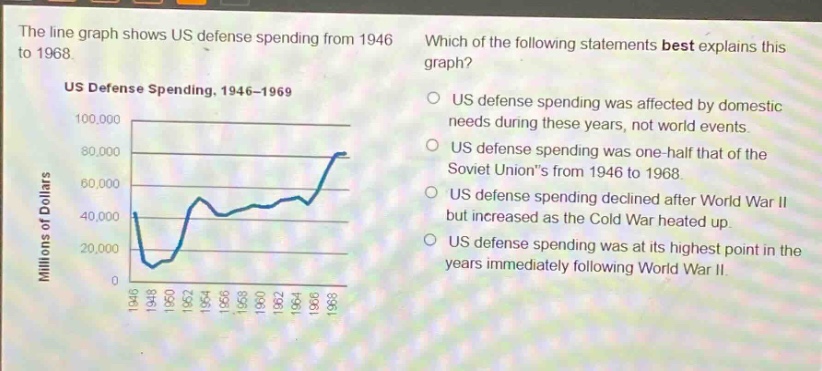
the line graph shows us defense spending from 1946 to 1968. which of the following statements best explains this graph? us defense spending, 1946 - 1969 us defense spending was affected by domestic needs during these years, not world events. us defense spending was one - half that of the soviet unions from 1946 to 1968. us defense spending declined after world war ii but increased as the cold war heated up. us defense spending was at its highest point in the years immediately following world war ii.
Answer
Brief Explanations:
After World War II ended in 1945, US defense spending initially declined as the need for wartime - level spending decreased. However, as the Cold War between the US and the Soviet Union developed and tensions rose in the late 1940s and 1950s, defense spending increased. This is consistent with the trend shown in the graph. The other statements are incorrect: domestic needs were not the main factor compared to international events like the Cold War; there is no information about Soviet spending in the graph; and defense spending was not at its highest right after World War II.
Answer:
US defense spending declined after World War II but increased as the Cold War heated up.