the line graph shows us defense spending from 1946 to 1968. us defense spending, 1946 - 1969 which of the…
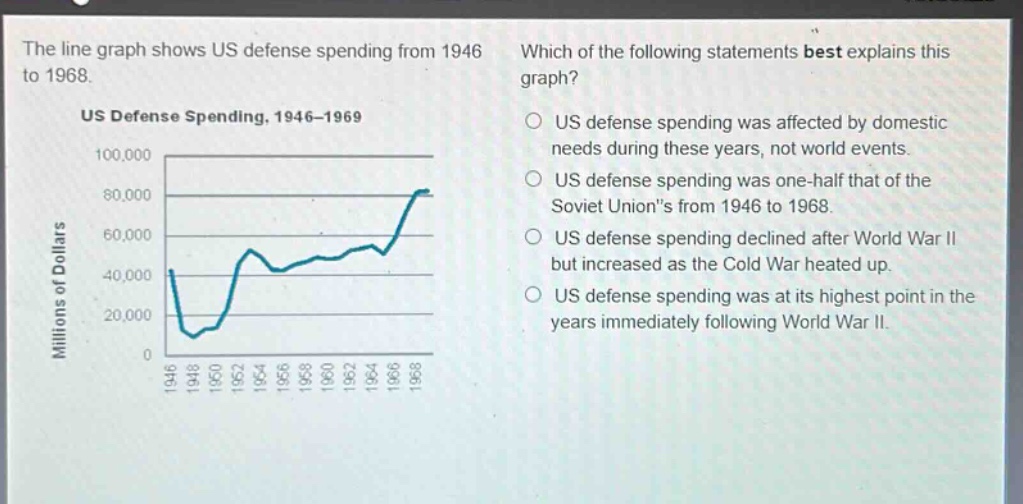
the line graph shows us defense spending from 1946 to 1968. us defense spending, 1946 - 1969 which of the following statements best explains this graph? us defense spending was affected by domestic needs during these years, not world events. us defense spending was one - half that of the soviet unions from 1946 to 1968. us defense spending declined after world war ii but increased as the cold war heated up. us defense spending was at its highest point in the years immediately following world war ii.
Answer
Answer:
C. US defense spending declined after World War II but increased as the Cold War heated up.
Brief Explanations:
The graph shows a post - WWII decline followed by an upward trend as Cold War tensions rose. Other options are inconsistent with the graph data.