look at the chart. the pie chart shows that the population of enslaved africans in 1789 spanish colonial…
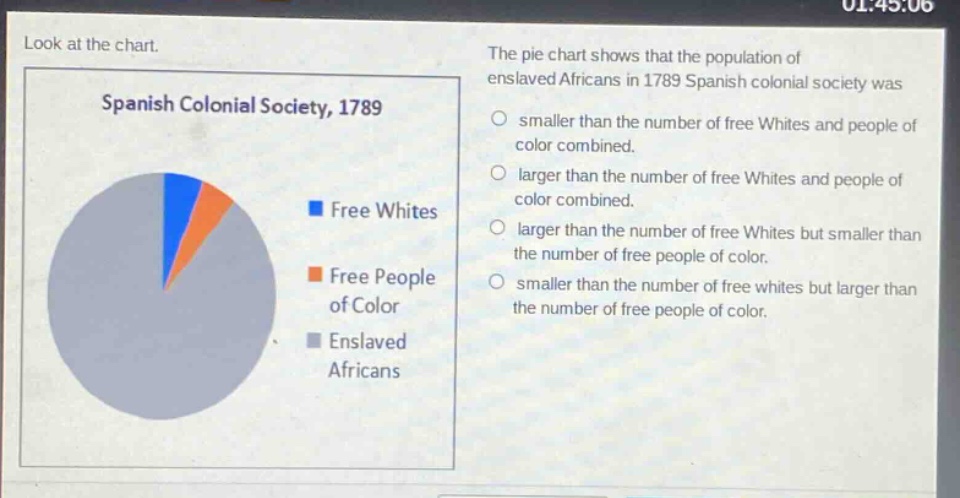
look at the chart. the pie chart shows that the population of enslaved africans in 1789 spanish colonial society was smaller than the number of free whites and people of color combined. larger than the number of free whites and people of color combined. larger than the number of free whites but smaller than the number of free people of color. smaller than the number of free whites but larger than the number of free people of color. spanish colonial society, 1789 free whites free people of color enslaved africans
Answer
Brief Explanations:
By observing the pie - chart, the combined slices of free Whites and free people of color are smaller than the slice of enslaved Africans.
Answer:
The population of enslaved Africans in 1789 Spanish colonial society was larger than the number of free Whites and people of color combined.