10. christa has just purchased a new car and wants to know how the speed at which she drives changes the…
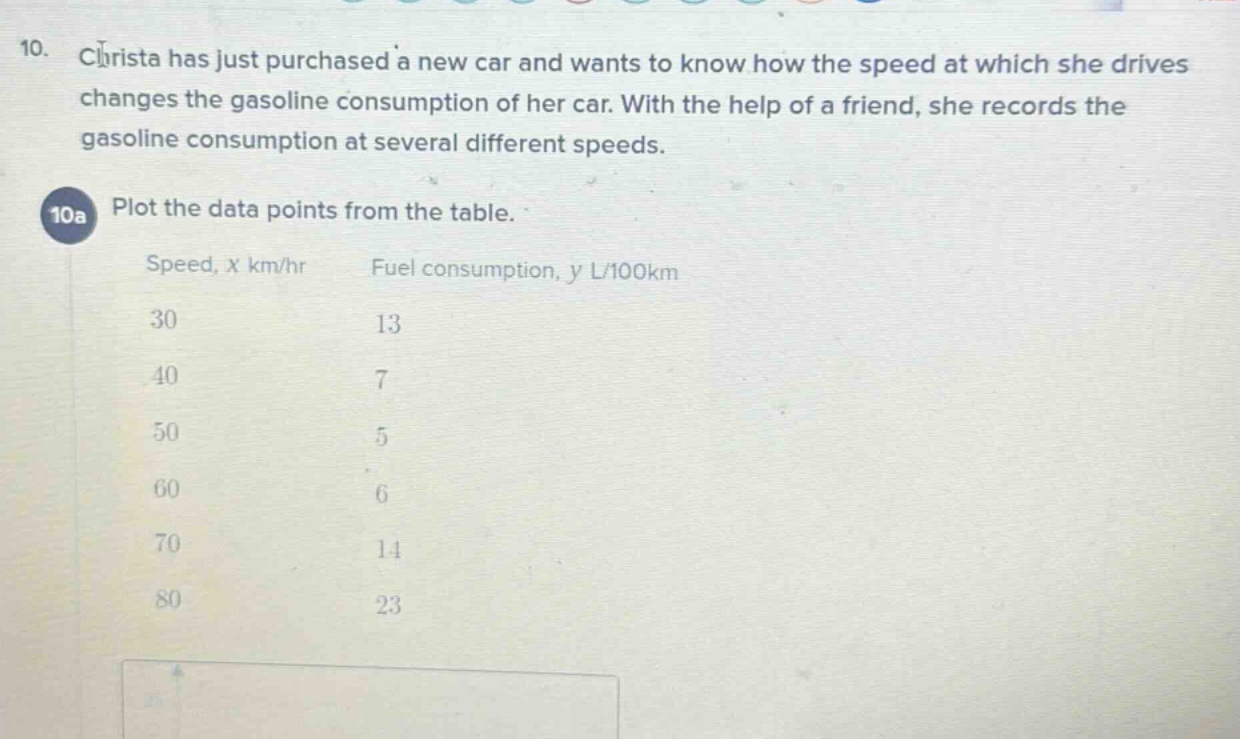
10. christa has just purchased a new car and wants to know how the speed at which she drives changes the gasoline consumption of her car. with the help of a friend, she records the gasoline consumption at several different speeds.\n10a plot the data points from the table.\nspeed, x km/hr fuel consumption, y l/100km\n30 13\n40 7\n50 5\n60 6\n70 14\n80 23
Answer
Explanation:
Step1: Prepare graph axes
On a graph, label the x - axis as "Speed, x km/hr" with a scale that can accommodate values from 30 to 80. Label the y - axis as "Fuel consumption, y L/100km" with a scale that can accommodate values from 5 to 23.
Step2: Plot data points
For the speed value of 30 km/hr and fuel - consumption of 13 L/100km, find 30 on the x - axis and 13 on the y - axis and mark a point. Repeat this process for the other data pairs: (40,7), (50,5), (60,6), (70,14), (80,23).
Answer:
Data points are plotted on a graph with x - axis as speed and y - axis as fuel consumption according to the steps above.