ess investigation - the ripple effect - investigation c graph 2 compares the temperature at which wet mantle…
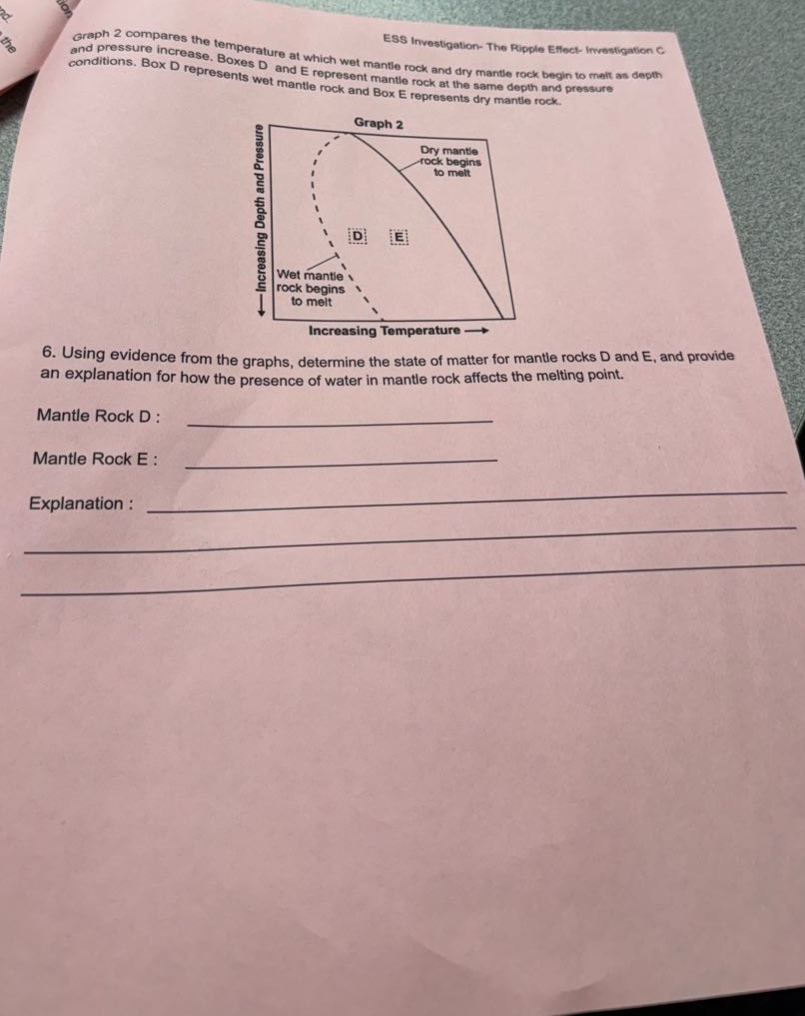
ess investigation - the ripple effect - investigation c graph 2 compares the temperature at which wet mantle rock and dry mantle rock begin to melt as depth and pressure increase. boxes d and e represent mantle rock at the same depth and pressure conditions. box d represents wet mantle rock and box e represents dry mantle rock. 6. using evidence from the graphs, determine the state of matter for mantle rocks d and e, and provide an explanation for how the presence of water in mantle rock affects the melting point. mantle rock d : ________ mantle rock e : ________ explanation : ________
Answer
Explanation:
Step1: Analyze Graph 2
We see that the curves represent the melting - point conditions for wet and dry mantle rock. Points D and E are located relative to these curves.
Step2: Determine state of Mantle Rock D
Since point D is below the "Wet mantle rock begins to melt" curve, Mantle Rock D is solid.
Step3: Determine state of Mantle Rock E
Since point E is above the "Dry mantle rock begins to melt" curve, Mantle Rock E is liquid.
Step4: Analyze effect of water on melting - point
The curve for wet mantle rock is at a lower temperature than the curve for dry mantle rock for the same depth/pressure. This means water lowers the melting point of mantle rock.
Answer:
Mantle Rock D: Solid Mantle Rock E: Liquid Explanation: The presence of water in mantle rock (as in Mantle Rock D) lowers its melting point compared to dry mantle rock (Mantle Rock E). Since Mantle Rock D is below the wet - mantle - rock melting curve it is solid, and since Mantle Rock E is above the dry - mantle - rock melting curve it is liquid.