3. explain two ways that graphs and charts can help a scientist record their observations. (4 marks)
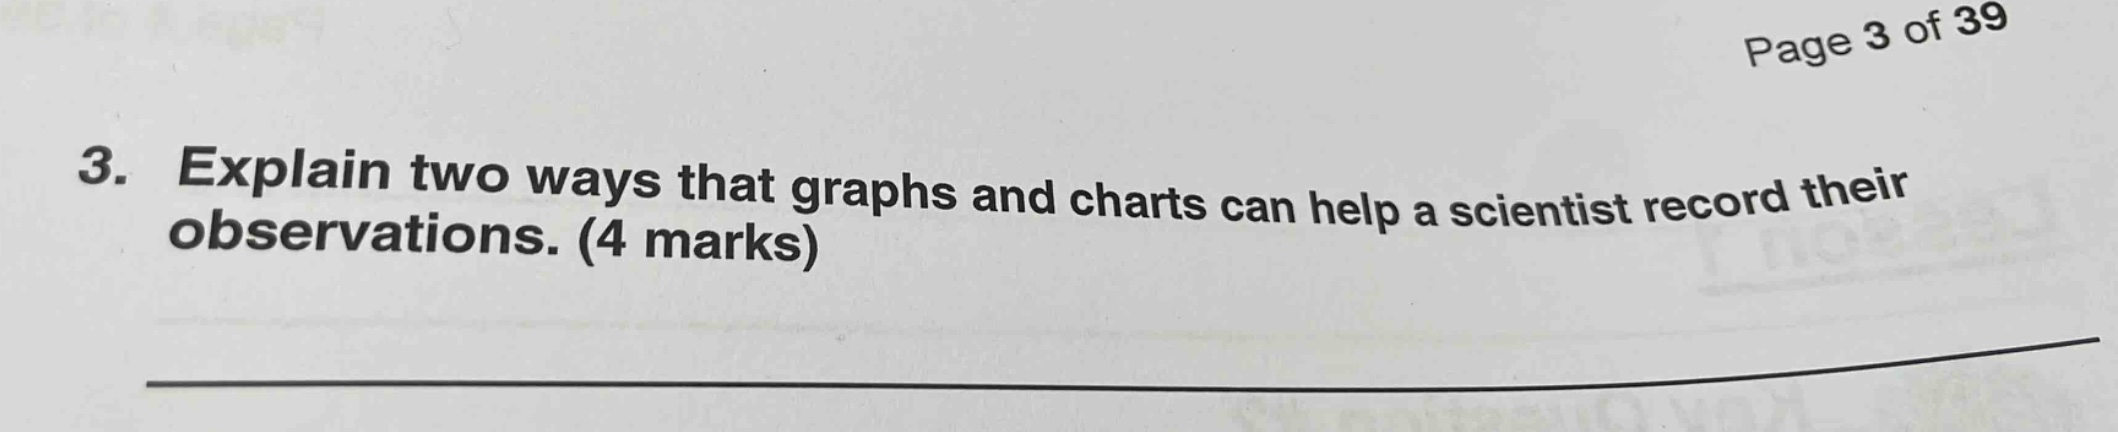
3. explain two ways that graphs and charts can help a scientist record their observations. (4 marks)
Answer
Brief Explanations:
- Visual representation: Graphs and charts present data visually, making it easier to identify patterns, trends, and relationships in the observations. For example, a line - graph can show how a variable changes over time.
- Data organization: They help in organizing large amounts of data in an orderly manner. A bar - chart can compare different categories of data clearly, allowing scientists to quickly understand the differences between them.
Answer:
- Provide visual representation of data to identify patterns and trends.
- Organize data in an orderly manner for easy comparison.