the graph indicates the prevalence of obesity among children and adolescents in the united states from 2009…
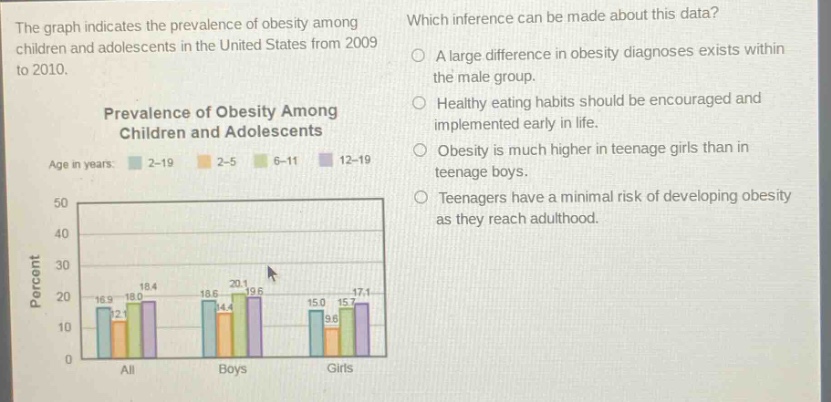
the graph indicates the prevalence of obesity among children and adolescents in the united states from 2009 to 2010. which inference can be made about this data? a a large difference in obesity diagnoses exists within the male group. b healthy eating habits should be encouraged and implemented early in life. c obesity is much higher in teenage girls than in teenage boys. d teenagers have a minimal risk of developing obesity as they reach adulthood. prevalence of obesity among children and adolescents age in years: 2 - 19 2 - 5 6 - 11 12 - 19 percent
Answer
Brief Explanations:
The data shows a significant prevalence of obesity among children and adolescents. Encouraging healthy eating habits early in life can help combat this trend. There is no clear evidence in the data for large differences within male groups, higher obesity in teenage girls than boys, or minimal risk for teenagers developing obesity in adulthood.
Answer:
B. Healthy eating habits should be encouraged and implemented early in life.