what does the graph show? the s and p waves travel the same distance through earths crust in the same amount…
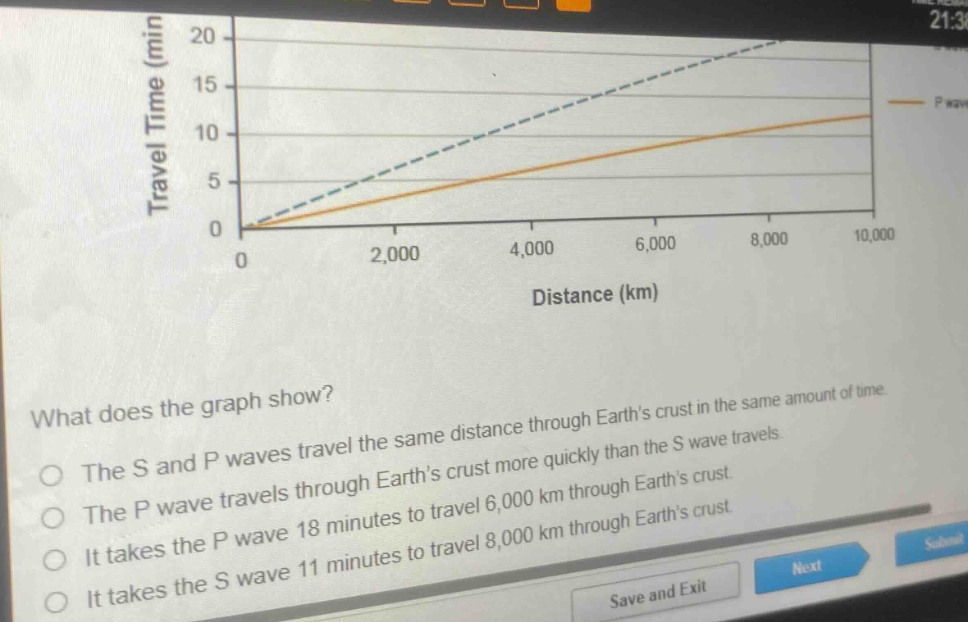
what does the graph show? the s and p waves travel the same distance through earths crust in the same amount of time. the p wave travels through earths crust more quickly than the s wave travels. it takes the p wave 18 minutes to travel 6,000 km through earths crust. it takes the p wave 18 minutes to travel 8,000 km through earths crust. it takes the s wave 11 minutes to travel 8,000 km through earths crust. save and exit next
Answer
Brief Explanations:
By observing the graph, we can see that for the P - wave, when the distance is 8000 km, the travel - time is 18 minutes. The other statements can be disproven by the graph. The S - wave is not shown in the graph, so we cannot make statements about it. And the P - wave is the only wave shown, and we can directly read the time - distance relationship for it from the graph.
Answer:
It takes the P wave 18 minutes to travel 8,000 km through Earth's crust.