the graph shows the effect of the number of passengers on the number of crashes per 10,000 trips. about how…
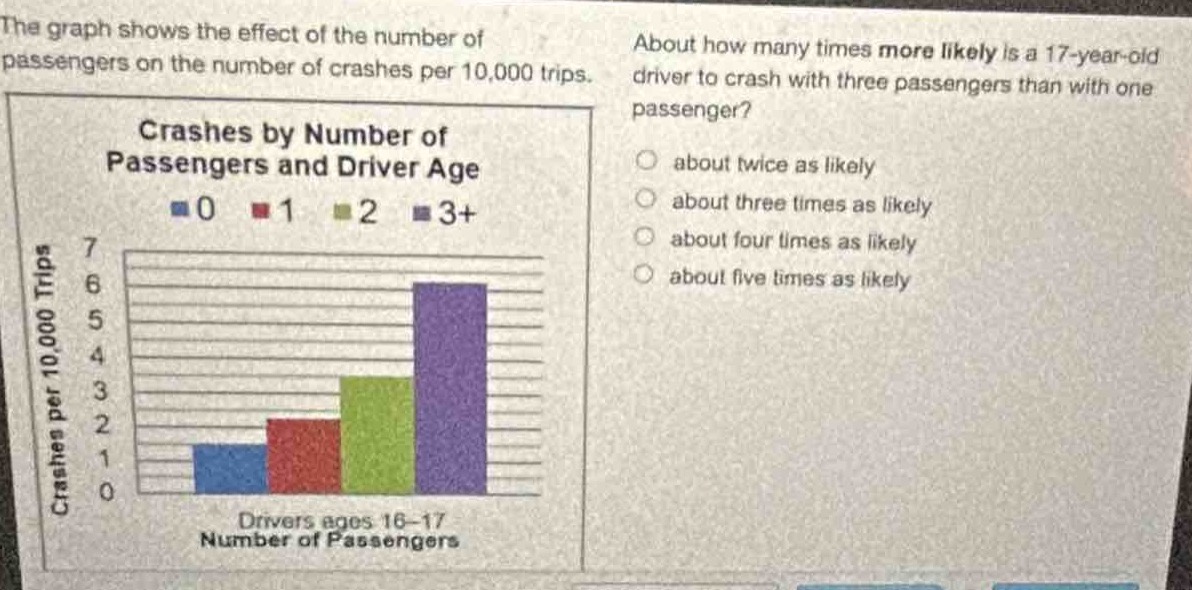
the graph shows the effect of the number of passengers on the number of crashes per 10,000 trips. about how many times more likely is a 17 - year - old driver to crash with three passengers than with one passenger? crashes by number of passengers and driver age 0 1 2 3+ crashes per 10,000 trips 7 6 5 4 3 2 1 0 drivers ages 16 - 17 number of passengers about twice as likely about three times as likely about four times as likely about five times as likely
Answer
Explanation:
Step1: Estimate crashes with 1 passenger
From the graph, for 17 - year - old drivers with 1 passenger, the number of crashes per 10,000 trips is about 2.
Step2: Estimate crashes with 3+ passengers
For 17 - year - old drivers with 3+ passengers, the number of crashes per 10,000 trips is about 6.
Step3: Calculate the ratio
To find out how many times more likely, we divide the number of crashes with 3+ passengers by the number of crashes with 1 passenger. So, $\frac{6}{2}=3$.
Answer:
about three times as likely