the graph shows the megawatts of electricity used on one day in one city. complete parts a through f.\nc…
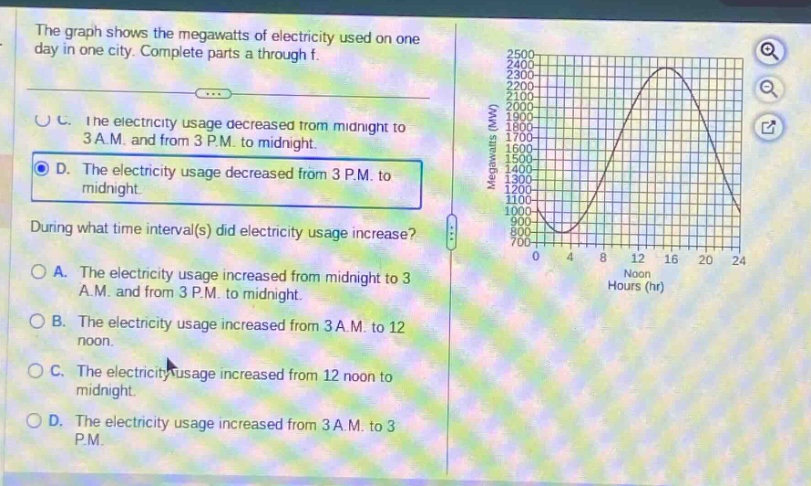
the graph shows the megawatts of electricity used on one day in one city. complete parts a through f.\nc. the electricity usage decreased from midnight to 3 a.m. and from 3 p.m. to midnight.\nd. the electricity usage decreased from 3 p.m. to midnight.\nduring what time interval(s) did electricity usage increase?\na. the electricity usage increased from midnight to 3 a.m. and from 3 p.m. to midnight.\nb. the electricity usage increased from 3 a.m. to 12 noon.\nc. the electricity usage increased from 12 noon to midnight.\nd. the electricity usage increased from 3 a.m. to 3 p.m.
Answer
Explanation:
Step1: Analyze the graph
Observe the trend of the curve representing electricity - usage over time.
Step2: Identify increasing intervals
The curve is rising when the electricity usage is increasing. From the graph, we can see that the electricity usage increases from 3 A.M. to 3 P.M.
Answer:
D. The electricity usage increased from 3 A.M. to 3 P.M.